
Figure 4.
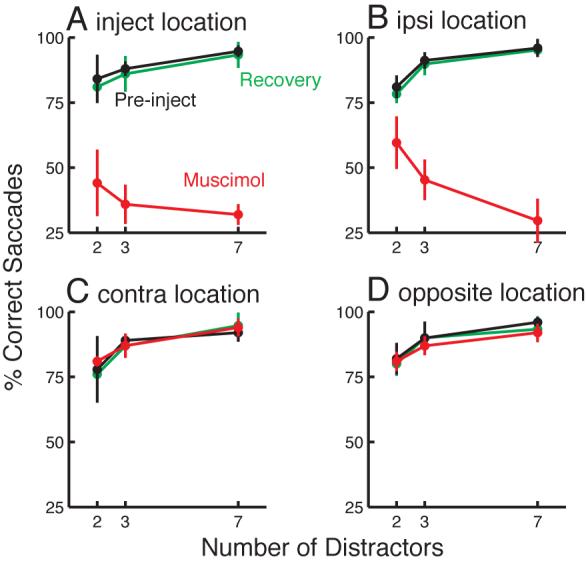
Effects of SC muscimol inactivation on target selection performance. Each panel shows performance for one of the four target locations, immediately pre-injection, during muscimol inactivation, and after recovery from inactivation (on the following day). Data are pooled across 3 injection sites, and target positions are normalized across sites as in Fig. 2. Pre-injection and after recovery, at all four target locations performance improved when a greater number of homogenous distractors was present in the display. A: At the inject location, performance during muscimol inactivation was worse overall, and declined slightly with more distractors, although the trend was not significant. B: At the ipsi location, performance also dropped after inactivation, and there was a highly significant decline with more distractors. C, D: At the other locations, performance during muscimol inactivation was similar to pre-injection performance. Error bars show +/− standard deviation across sites.