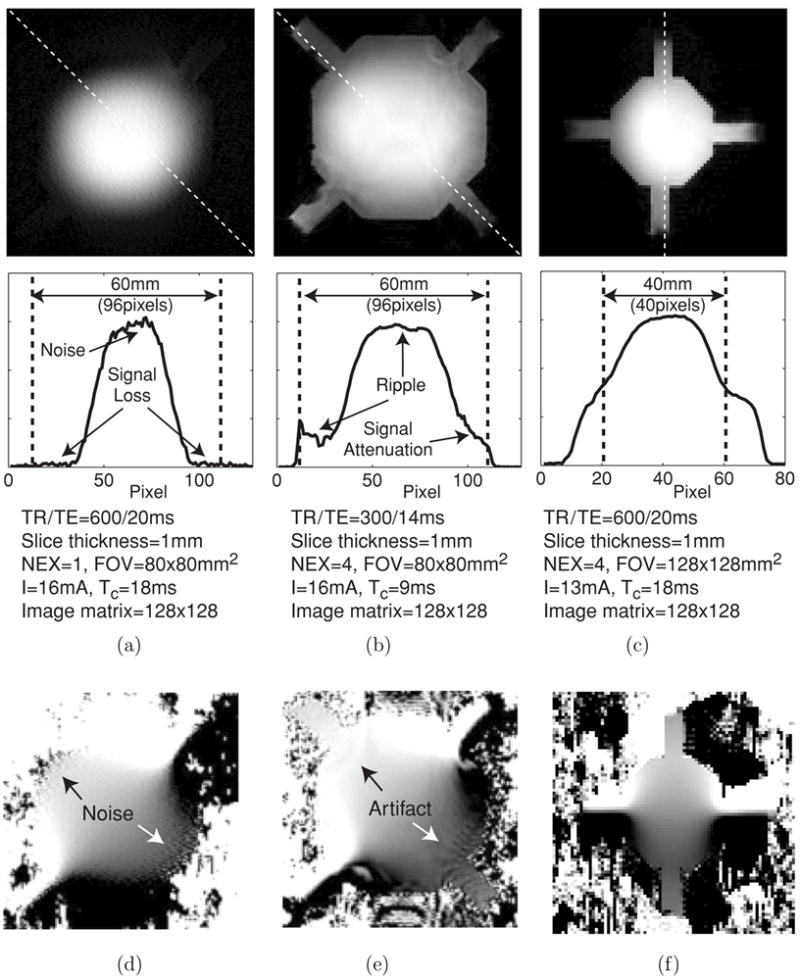
Figure 4.

Effects of different pulse sequences using homogeneous saline phantoms. Normalized magnitude images and their profiles in the 60 mm phantom using (a) SE and (b) GE pulse sequence. For (a) and (b), pixel size was 0.625 × 0.625 mm2. (c) Normalized magnitude image and its profile in the 40 mm phantom using the SE pulse sequence with 1 × 1 mm2 pixel size. One-dimensional profiles are shown below corresponding to the dotted lines in magnitude images. (d) and (e) images of the 60 mm phantom corresponding to (a) and (b), respectively. (f) image of the 40 mm phantom corresponding to (c).
