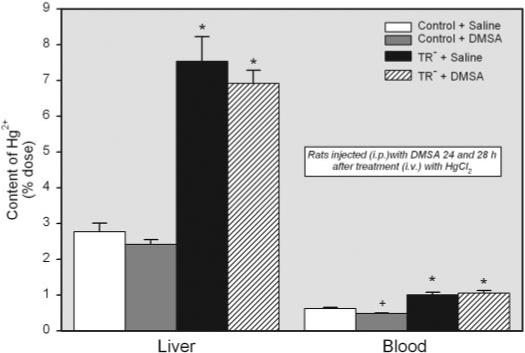
Fig. 7.

Content of Hg2+ in the liver and blood (percentage of administered dose) of control and TR− rats injected i.v. with 0.5 μmol/kg HgCl2 followed 24 and 28 h later by injection i.p. with 100 mg/kg DMSA. Livers and blood were harvested for determination of Hg2+ content 48 h after injection with HgCl2. Data represent mean ± S.E. of four rats. *, significantly different (p < 0.05) from the corresponding mean for control rats treated in the same manner. +, significantly different (p < 0.05) from the corresponding mean for the same strain of rats treated with saline.
