
Figure 4.
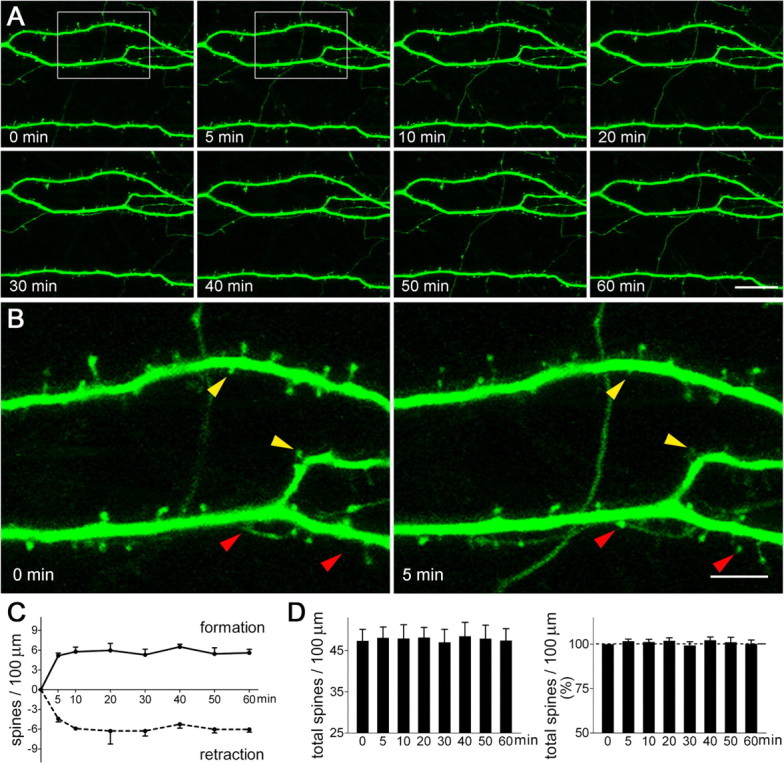
Dendritic spine dynamics in hippocampal pyramidal neurons, visualized using live, time-lapse two-photon microscopy. A, A series of images shows that the structure of the dendrites remained constant over the 60 min of imaging. B, During this period, new dendritic spines appeared (red arrowheads) and existing ones disappeared (retracted; yellow arrowheads) within minutes. C, Under the imaging conditions, spine formation and disappearance occurred at similar rates (F(1,48) = 0.02; p = 0.90). D, Spine density (left panel), expressed as numbers of total spines per unit dendritic length, was stable (p = 1), with little percentage change of spine density over the imaging period (right panel). A total of 2006 μm of dendritic branches from 12 neurons were imaged and analyzed blindly. Hippocampi were cultured on P1 and imaged on in vitro days 5–6. Error bars indicate SEM. Scale bars: A, 21.5 μm; B, 6.6 μm.