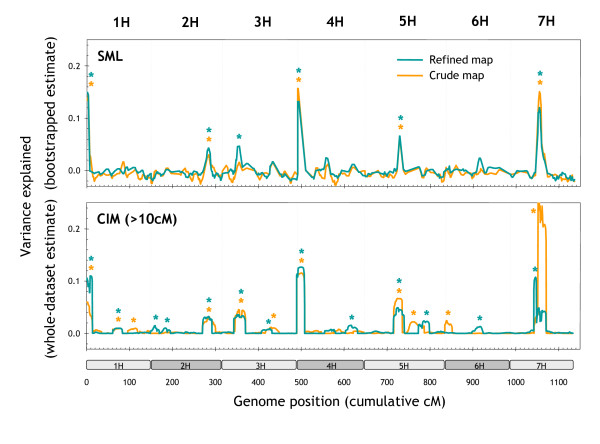
Figure 11.
Robustness to genotyping and linkage-mapping errors. Effect of map curation on QTL for diastatic power detected by SML and CIM. In the case of CIM, 20 markers at > 10 cM distance from the tested interval were used to adjust for the genetic background. Statistically significant peaks (p < 0.05) are labelled with asterisks.

