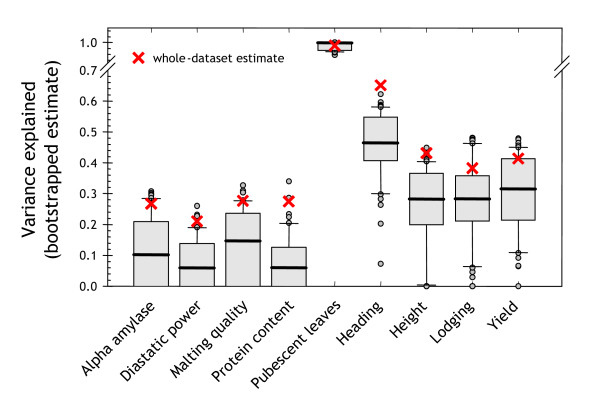
Figure 5.
Whole-dataset bias. Demonstration of the optimistic bias that arises when measuring predictive performance on training data. For each trait, the optimal marker was selected using MR, either on the entire dataset (red crosses) or within a 200-permutation zero bootstrap environment (box plots).

