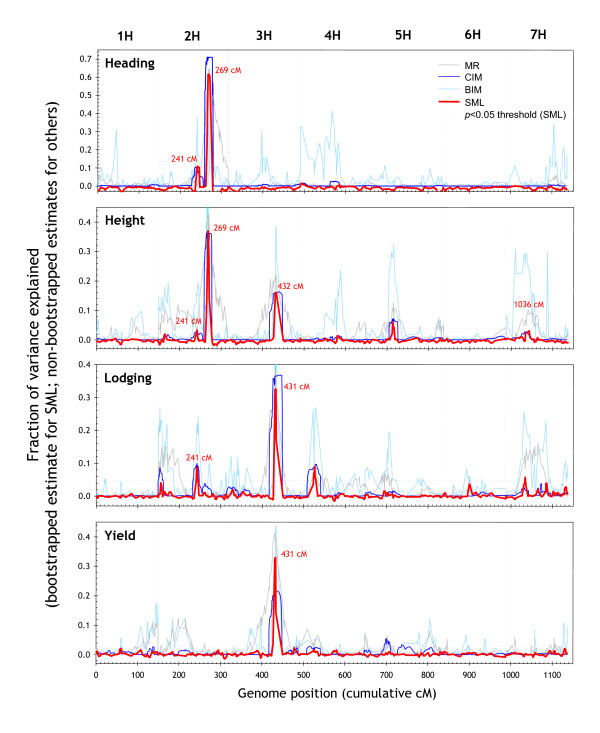
Figure 7.
Comparison of different QTL methods. Genome-wide QTL profiles for four traits generated by SML, MR, CIM and BIM. A 5 cM averaging window was applied to the BIM profile for plotting. Horizontal dotted lines are p < 0.05 thresholds for SML. The plots are based on the allele calls and genotypes underlying the 'raw' version of the linkage map (see section entitled 'Genetic-map construction' in Methods).

