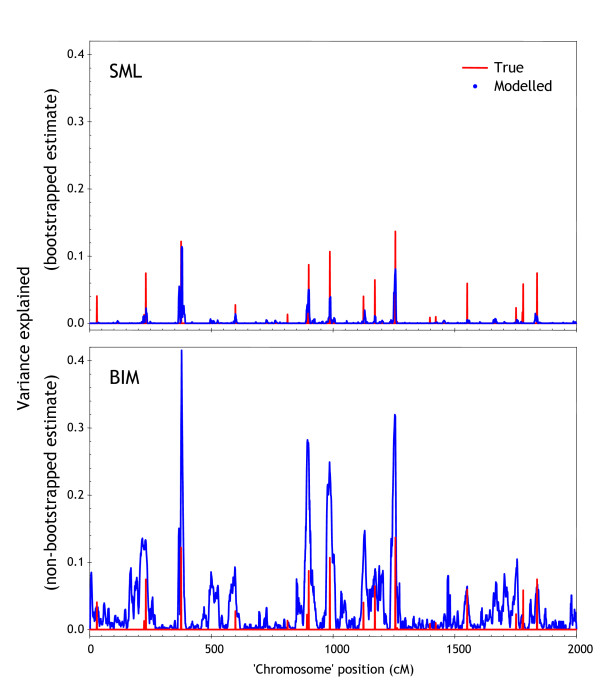
Figure 9.
SML and BIM genome profiles on synthetic data. Estimated QTL effects using BIM and SML for a single synthetic 'chromosome' of 2,000 cM length with 20 simulated QTL. QTL were positioned randomly with random strength. Red lines indicate true QTL locations, with height denoting strength. BIM profile smoothed using a 5 cM averaging window, and SML profile smoothed using a 5 cM summing window.

