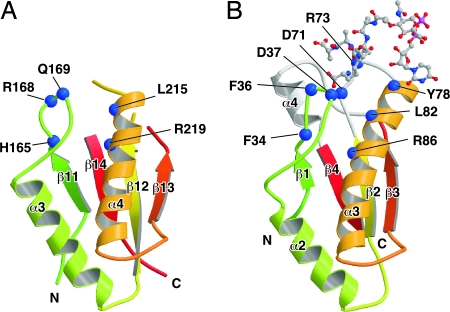
Fig. 3.
The peptidoglycan-binding regions of MotY (A) and Pal_Hi complexed with the peptidoglycan precursor (B). The residues contributing to binding of the peptidoglycan precursor and the corresponding residues in MotY (shown by the blue boxes in Fig. 2D) are indicated by blue balls. The polypeptide chains are drawn as Cα ribbon diagrams, with color coding going from green to red from the N terminus to the C terminus. The peptidoglycan precursor is shown in a ball-and-stick representation.

