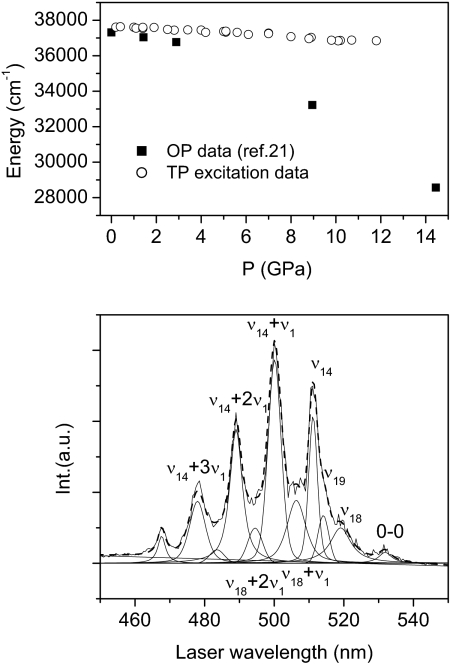
Fig. 3.
Analysis of TP spectra. (Lower) Deconvolution of a TP excitation spectrum measured in phase II crystalline benzene at 2.4 GPa; assignment is derived from ref. 24. (Upper) Pressure evolution of the 0–0 exciton transition energy. The open circles represent the values obtained in this study through the TP excitation profile, and filled squares represent the data gathered from ref. 21 extracted by saturated OP absorption spectra.

