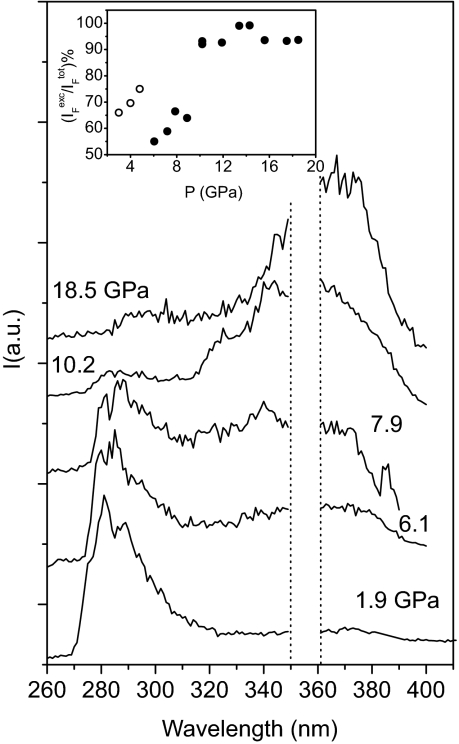
Fig. 4.
Pressure evolution of the TP fluorescence spectra. The high-frequency (280–300 nm) and broader low-frequency (320–400 nm) bands are due to the monomer and excimer emissions, respectively. The region between the dotted lines has been cut because of the presence of spurious signals resulting from the 355-nm laser line. In the Inset the pressure evolution of the intensity ratio between the excimer and total detected fluorescence is reported: filled circles represent spectra measured on compression, and open circles refer to spectra collected on releasing pressure on a sample previously compressed up to 13 GPa, and then decompressed down to 5 GPa, avoiding irradiation.

