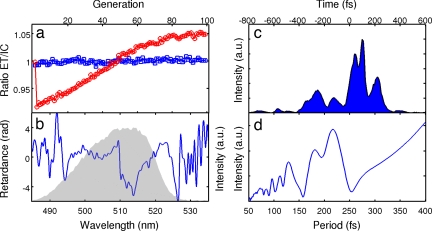
Fig. 3.
The closed-loop optimization of the ET/IC ratio. (a) The learning curve shows an improvement of ≈5% in the fitness value of the best individual (red circles). The blue squares indicate the fitness of the TL pulse, measured before each new generation. (b) The optimal phase function (blue line) and the pump spectrum (gray area). (c) Cross-correlation of the optimal pulse shape. (d) The power spectrum of the cross-correlation. a.u., arbitrary units.

