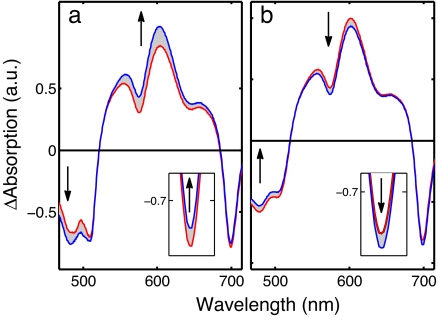
Fig. 4.
The transient spectra at an 8-ps probe delay using TL pulse (red line) and the found optimal shapes (blue line). (a) IC/ET optimization: PT increases, IC increases, and the ET reduces slightly. (b) ET/IC optimization: PT decreases, IC decreases, and the ET increases. (Insets) Zoom-in views of ET signals at ≈700 nm. The arrows indicate the change from the TL to the optimal pulse shapes. a.u., arbitrary units.

