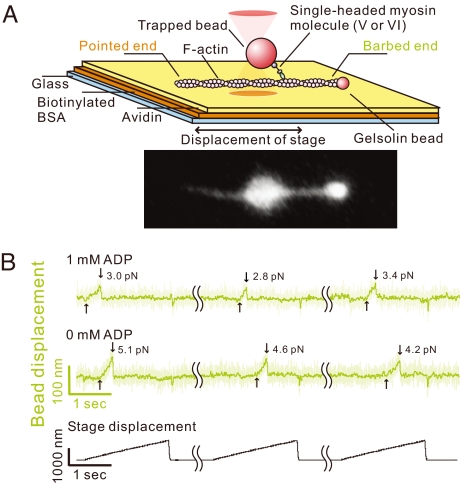
Fig. 1.
Myosins V and VI unbinding force measurements. (A) Schematic drawing of the experimental setup and the fluorescence image of a bead–actin filament system. Polarity of a bead-tailed actin filament can be clearly determined. (B) Typical traces showing bead movement during pulling–unbinding of individual single-headed myosin V–actin complex under forward (barbed-end directed) load. Traces at each ADP concentration (1 and 0 mM) were obtained with the same bead; the futile stage displacements, during which no binding was detected, and waiting time (5–10 sec between consecutive stage displacements) are not shown (wavy lines indicate elipsed data). Light green trace indicates the raw data (collected at 10 kHz), and dark green trace is the low-pass filtered data (50 Hz). The moment at which the external load began to be imposed on the actomyosin bond, and the moment of the unbinding are indicated by the upward and downward arrows, respectively. The trace jumps slightly when the stage quickly returns to the initial position. Representative traces for myosin VI are shown in Fig. S4.

