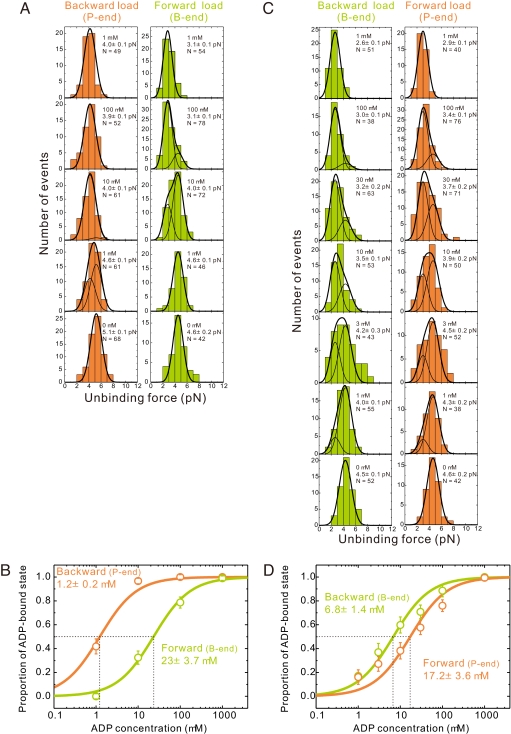
Fig. 2.
ADP affinity of myosins V and VI depends on loading direction. (A) Unbinding force distributions of individual myosin V–actin complexes at various ADP concentrations (0–1 mM). ADP concentration and total number of data, N, are shown in the upper right corners. Slender curves are the results of globally fitting histograms to two Gaussian fits [corresponding to the detachment in stronger (rigor) and weaker (ADP) binding states], separately for the backward (pointed-end directed) and forward (barbed-end directed) loading. The bold curves are the sum of two slender curves. (B) Estimation of the apparent ADP dissociation constants of actomyosin V under backward or forward load. Proportion of the ADP state is calculated as the ratio of the area of the left peak to the total area of the unbinding force distribution obtained by a global fit. Error bars represent the SEM, calculated as (p·(1 − p)/N)1/2, where p is the existence probability of the ADP-bound state and N is the total number of data at each ADP concentration. (C and D) Similar analysis for individual myosin VI–actin complexes. In all images, data obtained under barbed (B)- and pointed (P)-end-directed loading are green and orange, respectively.

