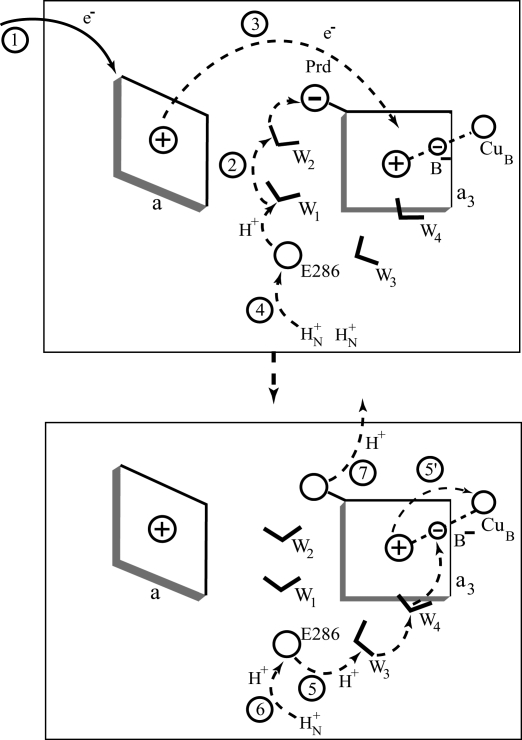
Fig. 2.
Schematic diagram of the primary PT from E to P and the subsequent events. Because of space limitation, we do not draw each step separately; thus, the charges correspond to the first step in each figure. Here, we designate a reduced and oxidized heme by “a” and “a+,” respectively. We are not excluding here a possibility that the proton moves from Prd to another site after step 3.

