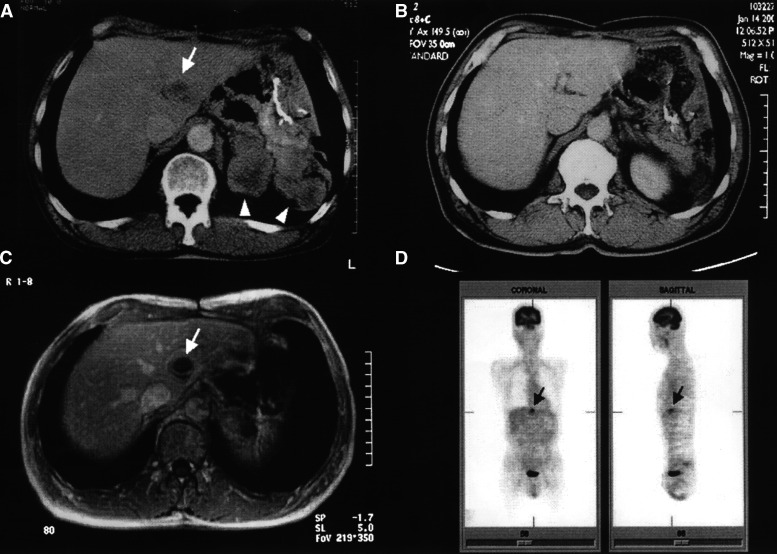
Figure 1.
Response to imatinib treatment. Computed tomographic examination before imatinib treatment: a solitary liver metastasis (arrow) and multiple peritoneal metastases (arrowheads) (A), CT scan after 6 months of imatinib treatment showing a partial response (B), gadolinium-enhanced T1-weighted MRI after 9 months of imatinib treatment showing disease progression only in the liver metastatic deposit (arrow) (C), PET scan after 10 months of imatinib treatment. The increased uptake of the tracer [18F]FDG was seen only in the liver metastatic deposit (arrow) (D).

