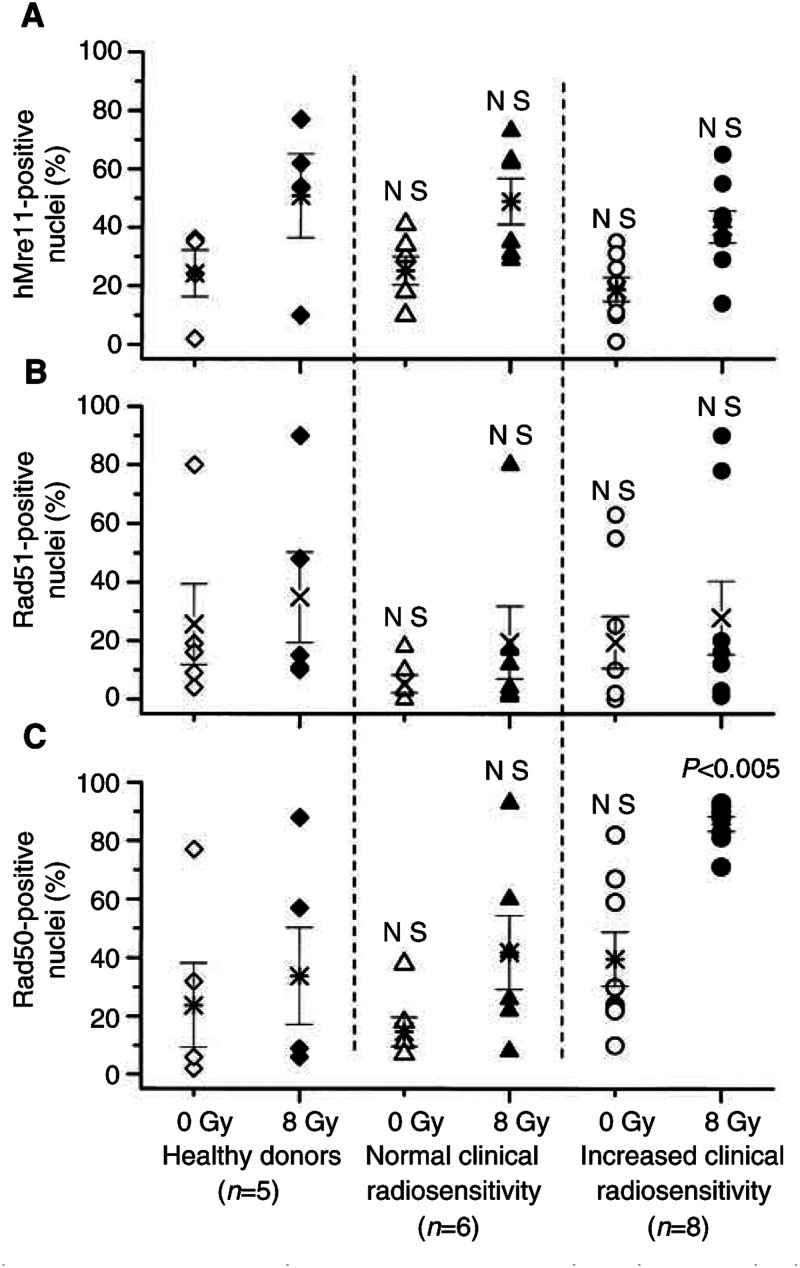
Figure 5.
Percentages of cells containing nuclear foci of hMre11 (top), Rad51 (middle) and Rad50 (bottom) before (open symbols) and 2 h post-irradiation with 8 Gy (solid symbols). Each symbol (except stars) represents the mean value obtained for 100 cells derived from a given individual, in at least two independent experiments. Stars represent mean value (±s.e.) averaged through each tested group. ‘NS’ indicated that the difference was not highly significant (P>0.05).

