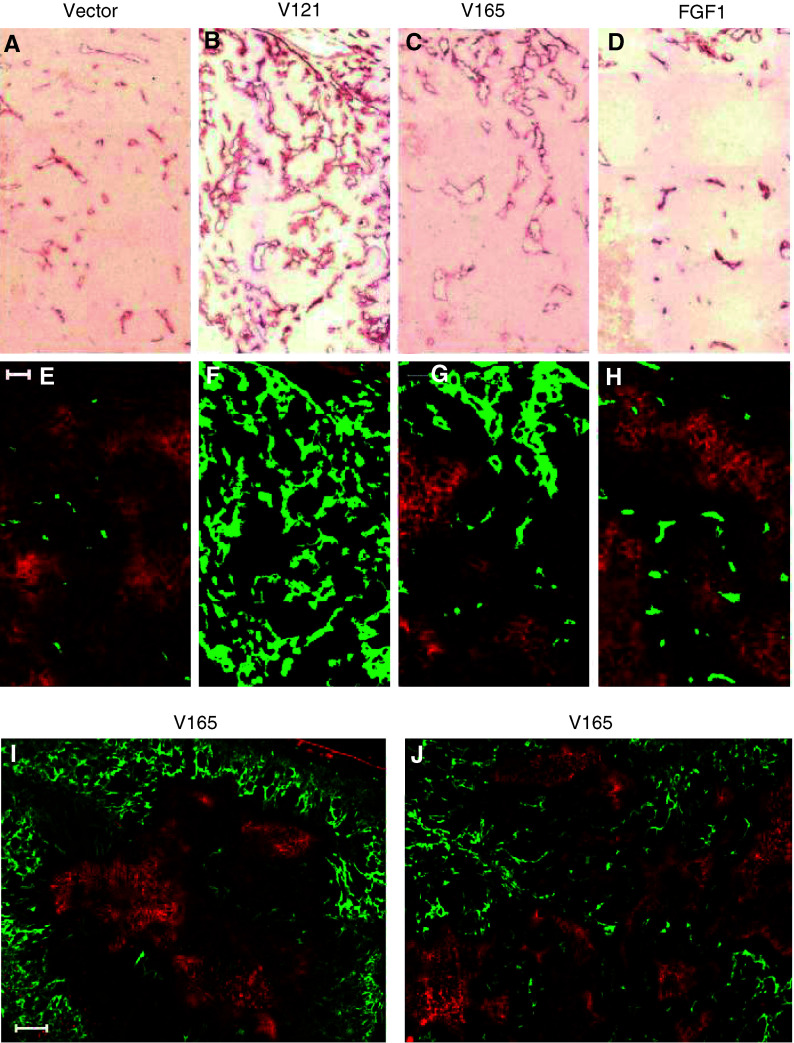
Figure 1.
Representative immunohistochemical staining of antipanendothelial cell antigen in panels (A–D), with corresponding images of the DiOC7 perfusion marker (green) superimposed over the EF5 hypoxia marker (orange), in panels (E–J). Intensely stained orange regions of (E–J) correspond to increased tumour hypoxia. MCF-7 vector is shown in (A) and (E), VEGF121 in (B) and (F), VEGF165 in (C) and (G), and FGF-1 in (D) and (H). Each of panels (A–H) are portions of the original 4 × 4 composite images taken with a × 20 objective, and the bar in panel (E) equals 100 μm. Panels (I) and (J) are entire 4 × 4 composites taken with a × 10 objective (bar in panel (I) equals 500 μm), illustrating the two general patterns of vascular configuration and hypoxia observed in VEGF165 tumours. Peripheral vasculature with centralised hypoxia is shown in panel (I), and a more randomly distributed pattern of vasculature and hypoxia is shown in panel (J).

