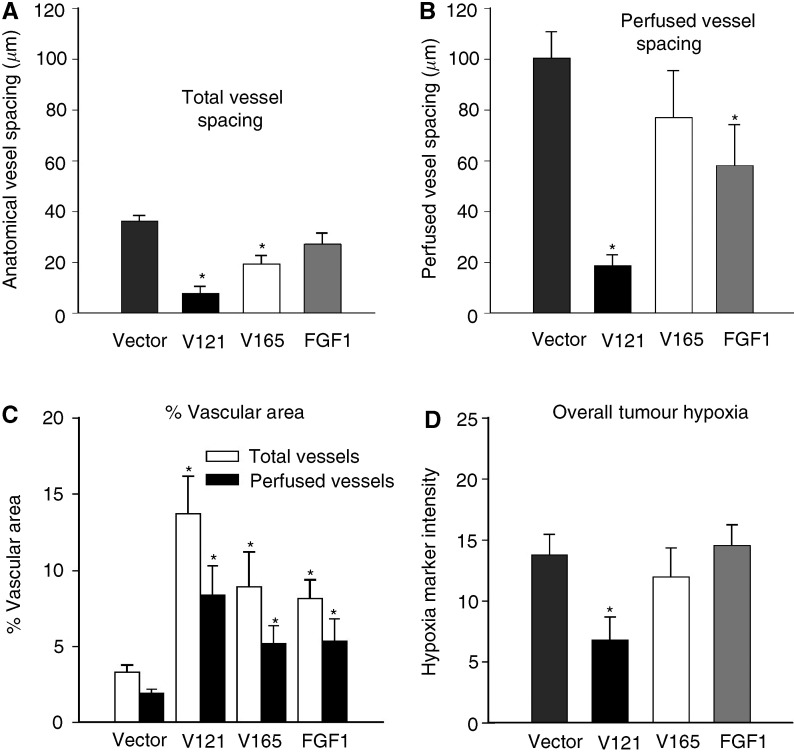
Figure 2.
Effects of VEGF isoforms and FGF-1 on vascular spacing, % vascular area, and overall hypoxia. Data are presented as median distances (mean±s.e.) to the nearest total (A) or perfused (B) blood vessel, and increased median distances correspond to decreased vascular densities. An increased disparity between the total and perfused bars for a given tumour type indicates an increased proportion of nonfunctional vessels in that tumour. Data are averaged over four 4 × 4 image montages (64 fields) from each of 10 MCF-7 vectors (mean volume±s.e.m.=410±90 mm3), six VEGF121 tumours (440±30)), five VEGF165 tumours (570±80), and nine FGF-1 tumours (440±90). (C) Percentage vascular area for total (open bars) and perfused (filled bars) vessels. Asterisks denote statistically significant differences from vector controls. (D) Tumour hypoxia, as measured by overall EF5/Cy3 intensity (mean±s.e.), again averaged over four 4 × 4 image montages.

