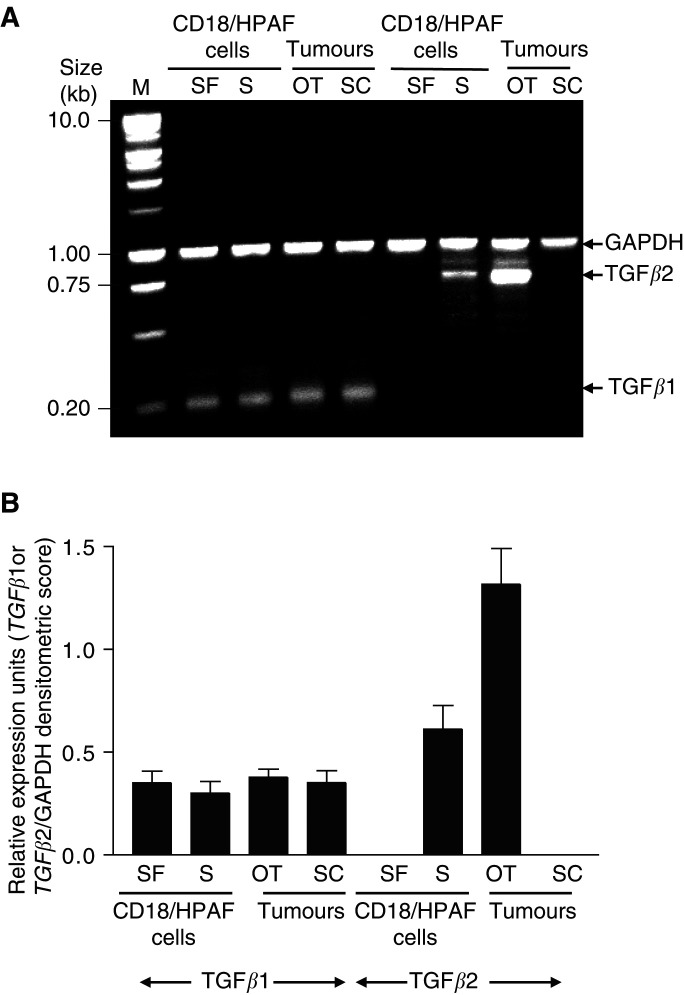
Figure 5.
(A) Analysis of TGFβ1 and TGFβ2 expression in CD18/HPAF cells, OT tumours, and SC tumours. Total RNA was isolated; TGFβ and GAPDH mRNA are coamplified in each reaction by RT–PCR. (B) The band intensity of the amplified products was quantified for each sample using the gel expert™ 3.5 software suite. The densitometric values (±s.e.) for the bands in three different experiments were calculated for a gene-specific product and GAPDH for each reaction. The value for a gene-specific product is expressed per unit of GAPDH to account for any differences in the starting amounts of RNA. OT, orthotopic tumour; SC, subcutaneous tumour; S, serum; SF, serum-free.

