Figure 4.
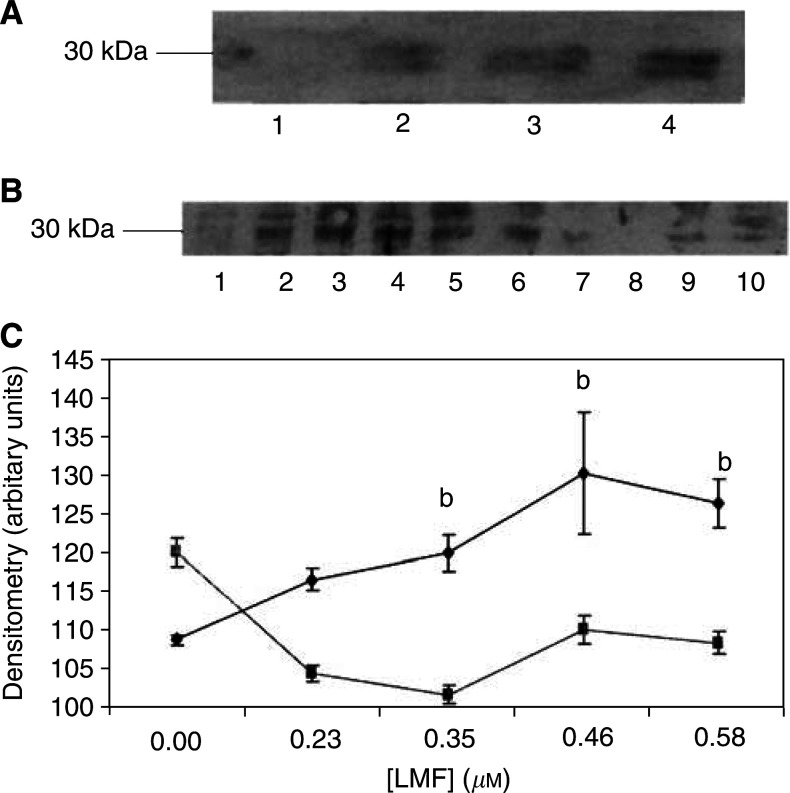
Immunoblot of UCP-2 expression in MAC13 cell line (A) in the presence of 0 (lane 1), 0.23 (lane 2), 0.35 (lane 3) and 0.58 (lane 4) μM LMF after 24 h incubation and (B) in the presence of 0 (lanes 1 and 6), 0.23 (lanes 2 and 7), 0.35 (lanes 3 and 8), 0.46 (lanes 4 and 9) and 0.58 (lanes 5 and 10) μM LMF for 24 h in the absence (lanes 1–5) or presence (lanes 6–10) of 10 μM SR59230A. (C) Densitometric analysis of the blot shown in (B). The symbols ♦ are in the absence of SR59230A and ▪ in the presence; n=3. Differences from values in the presence of SR59230A are indicated as b, P<0.01.

