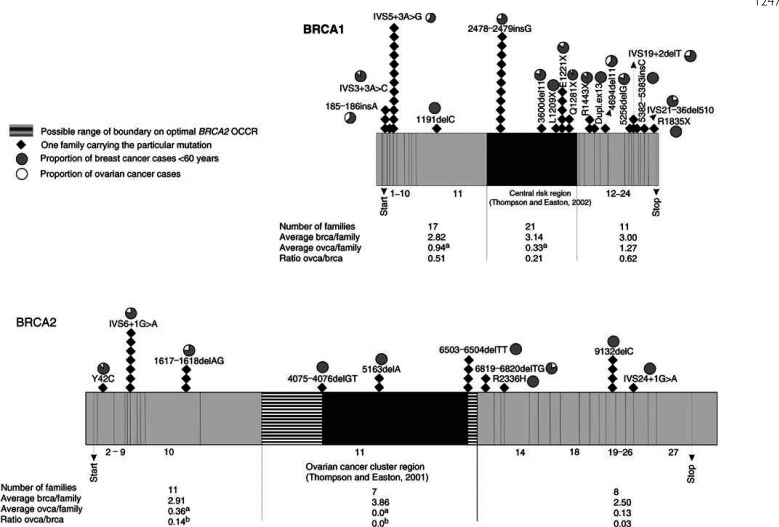
Figure 1.
Diagrammatic representation of BRCA1 and BRCA2 exons, showing 49 BRCA1 and 26 BRCA2 germline mutations identified in Belgian breast/ovarian cancer families selected for genetic testing. A correlation with the phenotype in each mutation-positive family was made based on the ratio of ovarian cancer cases to breast cancer cases. The central regions in both genes, proposed to be associated with an increased ovarian : breast cancer ratio by Thompson and Easton (2001, 2002), are marked. Furthermore, the distribution of breast (brca) and ovarian cancers (ovca) in families according to the site of BRCA1 and BRCA2 mutations are indicated. (a) Differences in risk of ovarian cancer were statistically significant for BRCA1 5′ vs central portion (P=0.027) and BRCA2 5′ vs central portion (P=0.038). (b) Differences in relative risks of ovarian vs breast cancer were statistically significant for BRCA2 5′ vs central portion (P=0.017).

