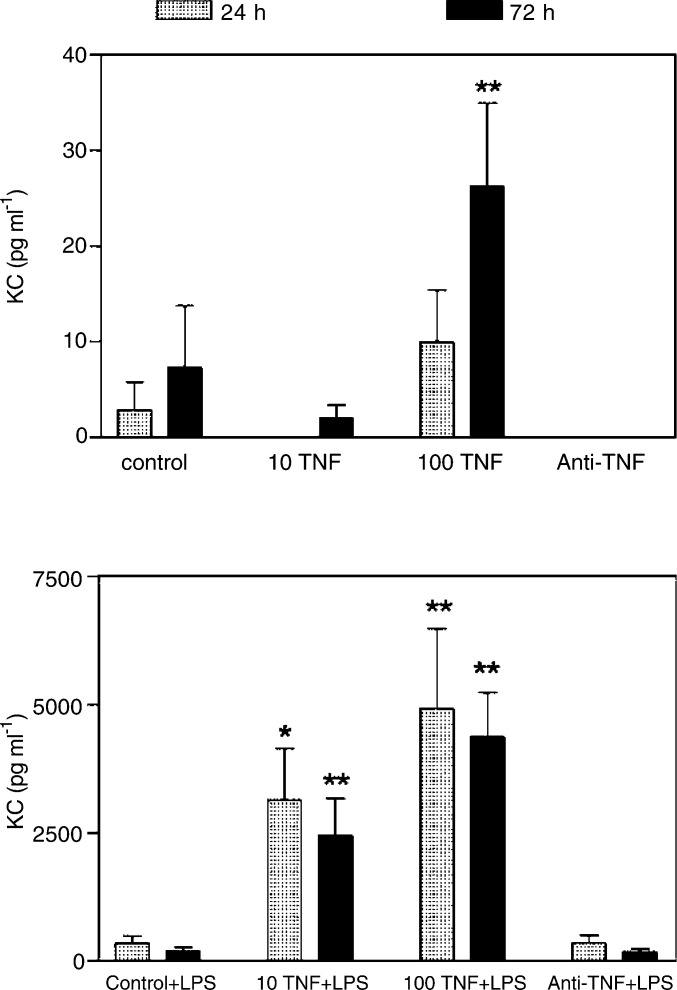
Figure 6.
Effects of TNF and LPS on KC production in B16F10 cells. Cells were plated out in triplicate at 2 × 10⁶ μl ml−1 in 200 μl well−1. To each well was added 10 μg ml−1 LPS, 10 or 100 ng ml−1 mTNF, 10 μg ml−1 murine anti-TNF monoclonal antibodies or media as a control as shown in the legend. Supernatants were removed at 24 and 72 h to measure KC levels by ELISA. Statistical significance was measured by the one-way ANOVA test. These are pooled results from two experiments.

