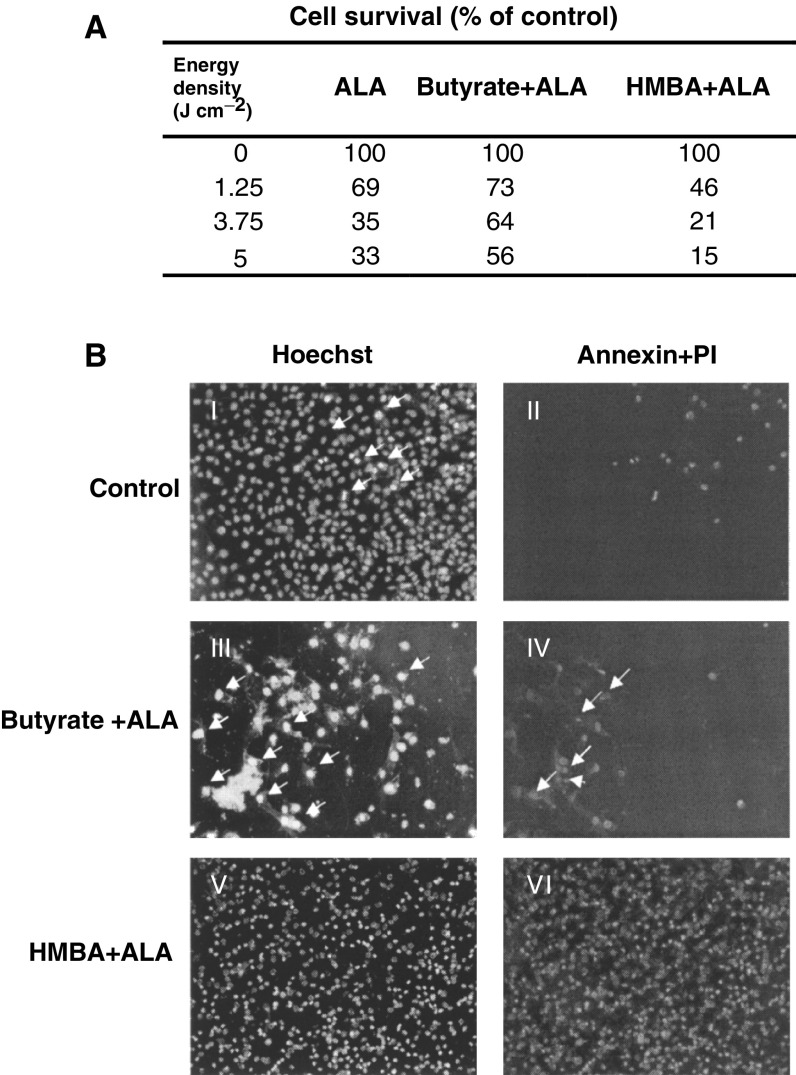
Figure 2.
The effect of ALA and photo-irradiation on differentiated B16 melanoma cells. (A) The percentage of viable cells 24 h post photoirradiation was measured by an MTT assay. (B) Annexin reaction of irradiated cells with 3.75 J cm−2. The original photomicrographs mirror the intrinsic colors of the reactive materials I and II. Control cells were not treated with ALA. Arrows point to necrotic cells. Figs III and IV – cells were treated with butyrate +ALA. In III arrows point to necrotic cells, and in IV – the arrows point to apoptotic cells. Figs V and VI – cells were treated with HMBA+ALA. In V all the cells are necrotic.

