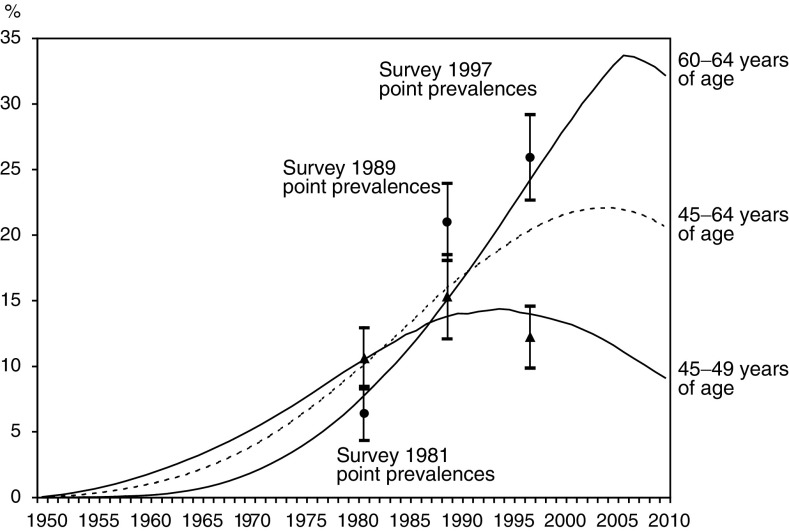
Figure 2.
Age-specific prevalence rates of hysterectomy in 1950–2010 in age groups 45–49 years (black line) and 60–64 years (grey line), based on estimated incidence rates. The vertical bars indicate the respective point prevalence rates of the three population-based surveys (Aromaa et al, 1989, Luoto et al, 1994, Vartiainen et al, 1998) together with their 95% confidence intervals. Dotted line shows the time trend of age-adjusted prevalence of hysterectomy in age range of 45–64 years.

