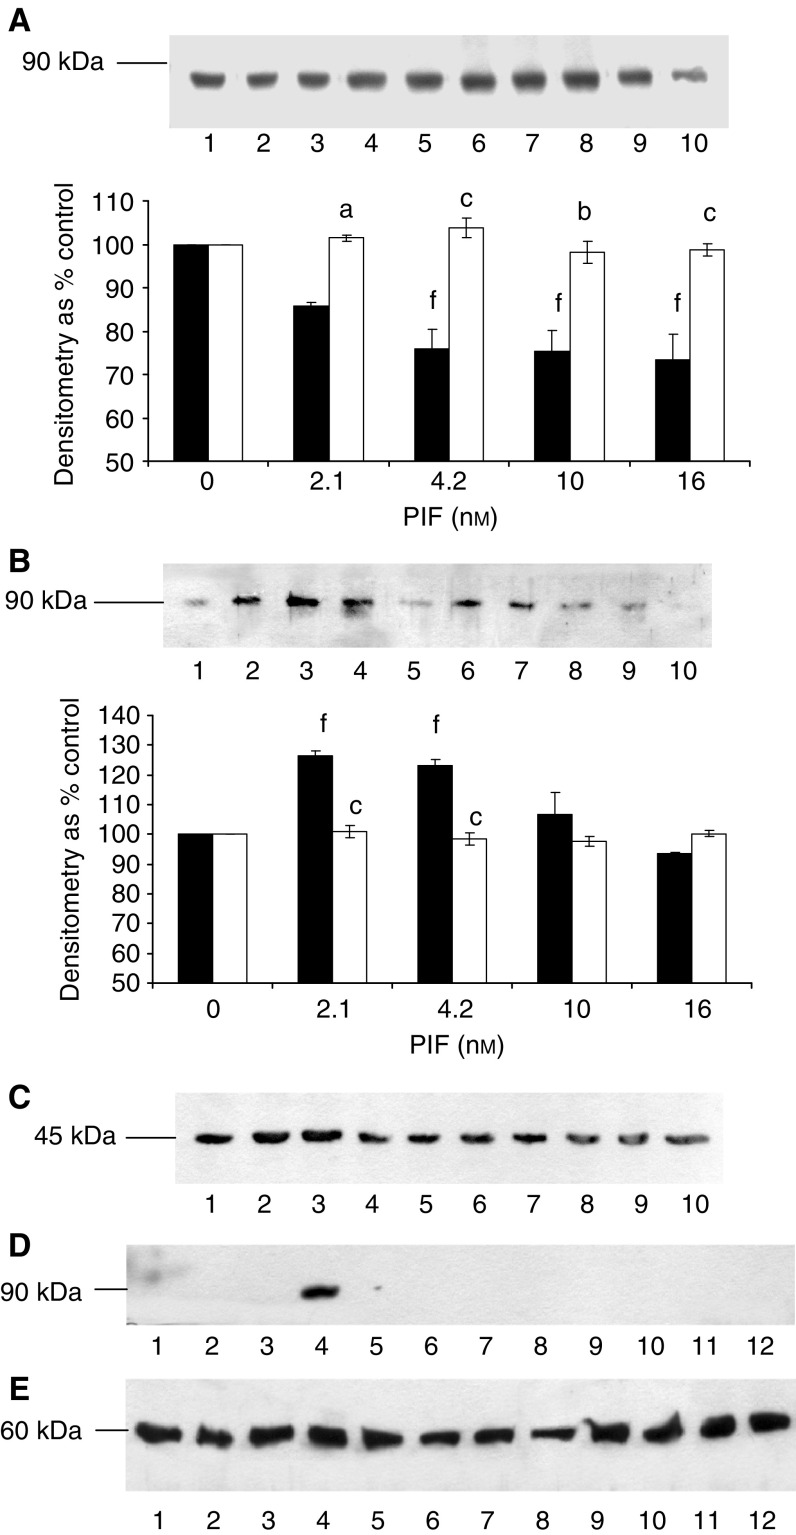
Figure 4.
Effect of PIF on activation of PKCα in murine myotubes in the absence or presence of calphostin C (A, B) or EPA (C). (A) Cytoplasmic and (B) Membrane-bound PKCα after incubation with 0 (lanes 1 and 6), 2.1 (lanes 2 and 7), 4.2 (lanes 3 and 8), 10 (lanes 4 and 9) or 16.8 nM PIF (lanes 5 and 10) for 24 h in the absence (lanes 1–5) or presence (lanes 6–10) of calphostin C (300 nM). The densitometric analysis was based on three replicate blots, and values in the presence of PIF are shown as ▪ and in the presence of PIF and calphostin C as □. Differences from control are shown as cP<0.001, while differences from PIF alone are shown as dP<0.05, eP<0.01 and fP<0.001. (C) Actin loading control for the blots shown in (A, B). (C) Actin loading control for the blots shown in (A, B). (D) Effect of EPA (50 μM) on membrane-bound PKCα in the presence of PIF. Cells were loaded with 0 (lanes 1 and 7), 1.0 (lanes 2 and 8), 2.1 (lanes 3 and 9), 4.2 (lanes 4 and 10), 10 (lanes 5 and 11) or 20 nM PIF (lanes 6 and 12) either in the absence (lanes 1–6) or after 2 h pretreatment with EPA (50 μM), and membrane-bound PKCα was determined after 24 h. (E) β-tubulin loading control for the blot shown in (D).

