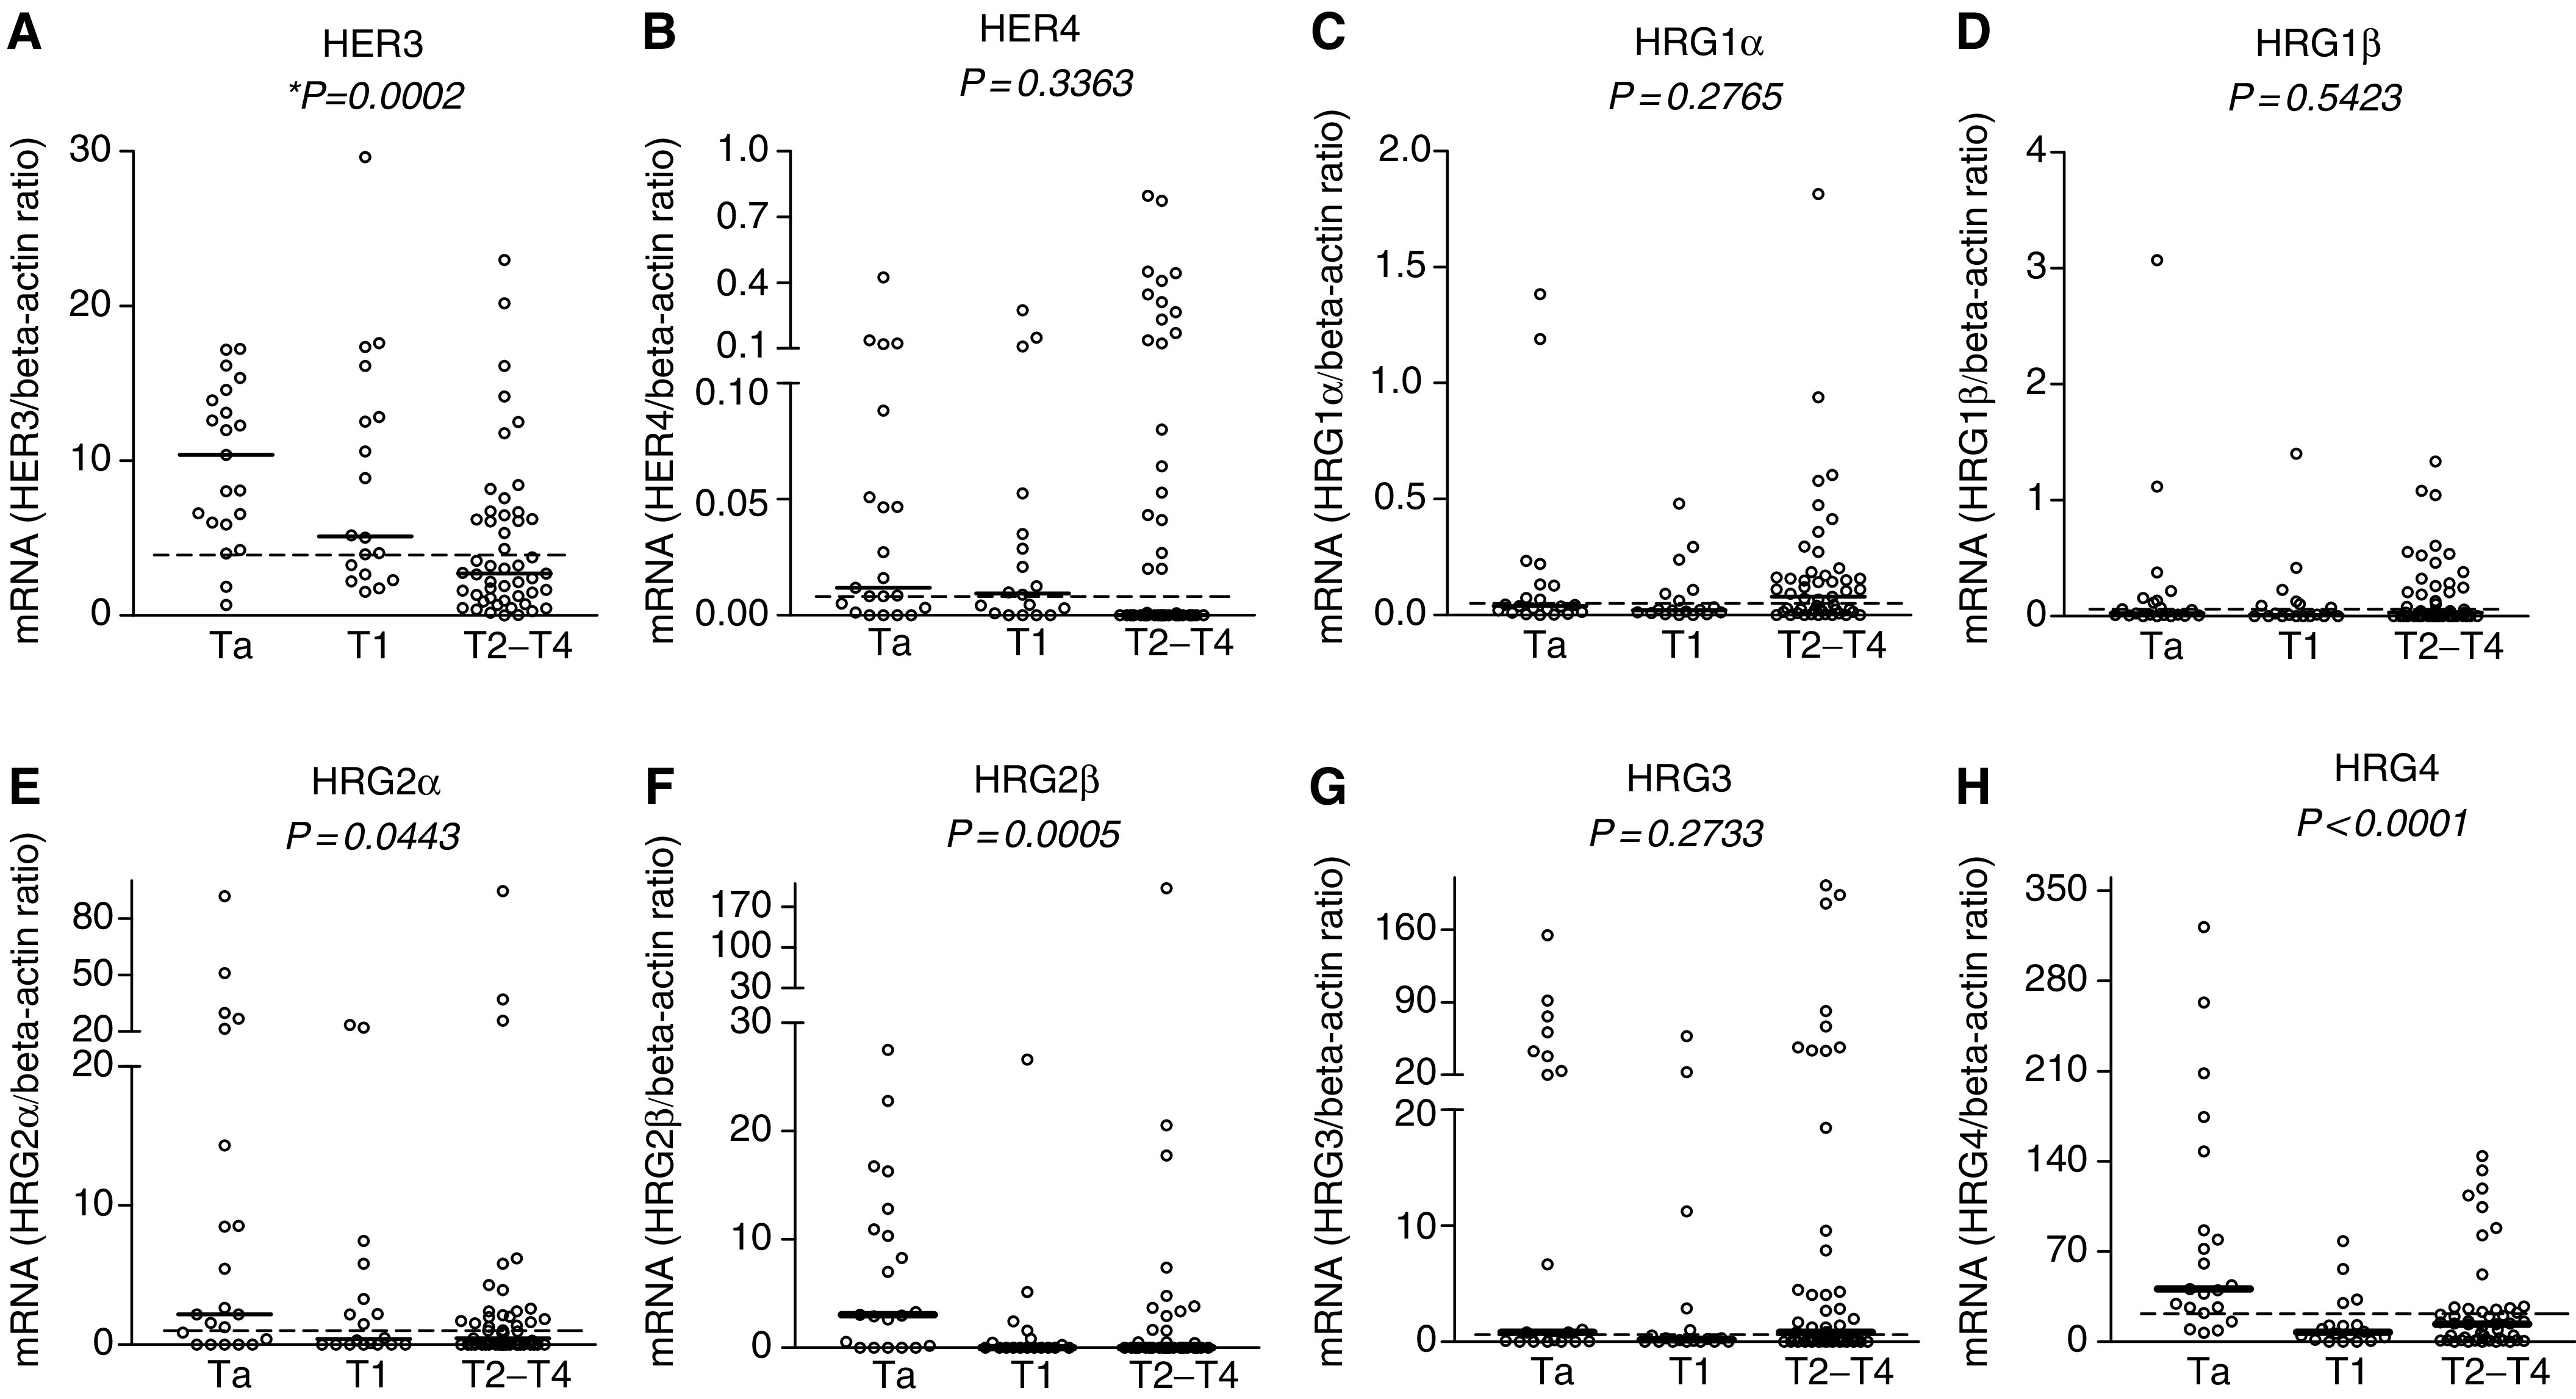
Figure 1.

mRNA expression of HER3 (A), HER4 (B) and their ligands HRG1α (C), HRG1β (D), HRG2α (E), HRG2β (F), HRG3 (G) and HRG4 (H) in 88 human biopsy samples. Horizontal dashed lines show the median cutoff (median of all samples) used for survival analysis. Median cutoff for HRG2β was zero and samples were categorised as no HRG2β expression (low) or HRG2β-positive expression (high). Solid horizontal lines demonstrate the median of each individual group. All data are shown as the ratio between the target gene and beta-actin. *P-value, nonparametric Kruskal–Wallis test.
