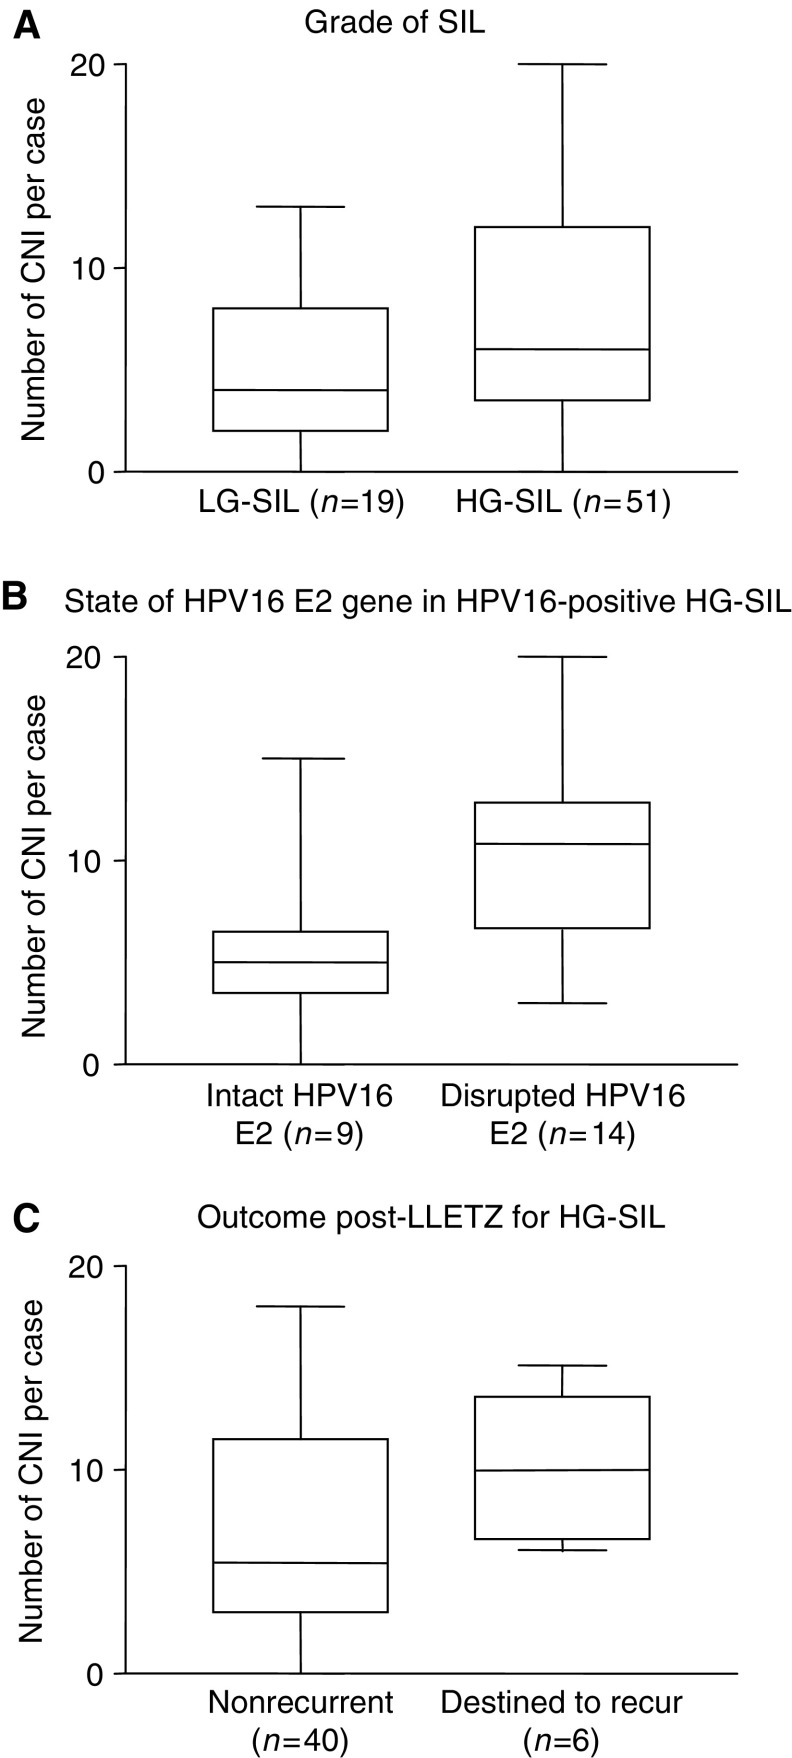
Figure 4.
Number of CNIs per case according to selected clinicopathological features. Plots show the median (line), interquartile range (box) and full range (whiskers) of numbers of chromosome arms showing CNI per case in different groups of cases. There are significantly more CNIs per case in: (A) HG-SILs vs LG-SILs (P=0.04); (B) HPV16-positive HG-SIL with disrupted HPV16 E2 vs HPV16-positive HG-SIL with intact HPV16 E2 (P=0.026) and (C) HG-SIL destined to recur post-LLETZ vs HG-SIL that did not recur (P=0.04).

