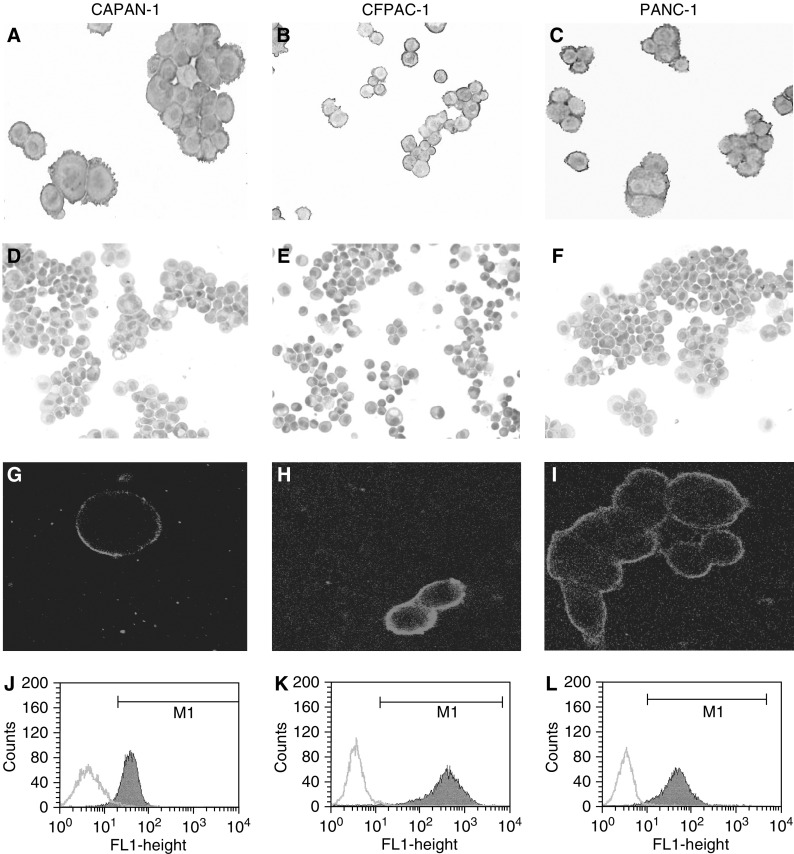
Figure 2.
Expression of MUC1 in pancreatic cancer cell lines. Representative pictures are shown for immmunostaining with MAbs C595 (test) and A2 (control). MAb C595 was strongly positive in three cell lines (A–C), while MAb A2 was negative in three cancer cell lines (D–F). Brown staining indicates positive cells. The MUC1 cell surface expression in three cancer cell lines was confirmed by Confocal Microscope (G–I). Green staining indicates positive cells. Expression of MUC1 in three viable pancreatic cancer cell lines was assessed by FACA analysis (J–L). Data are presented as histograms, using a mouse IgG1-negative control to determine background fluorescence and to set the marker (M1). All of the photographs are at × 200 magnification.

