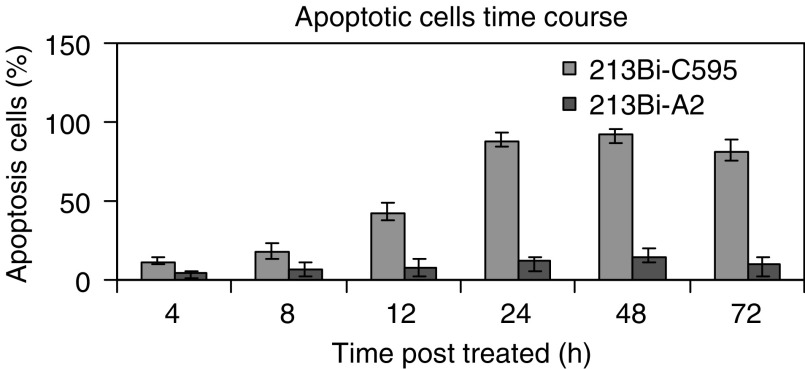
Figure 5.
Observation of apoptosis in time course after treatment with 213Bi-C595 and 213Bi-A2 AICs. Blue and red columns represent 213Bi-C595 and 213Bi-A2, respectively. The PANC-1 cells were treated with 213Bi-C595 and 213Bi-A2 with concentrations of 10 μCi 105cells−1, incubated at 4, 8, 12, 24, 48 and 72 h, tested by TUNEL assay, and expressed as a percentage of TUNEL-positive cells in total cells. Each experiment was performed in triplicate, and each point represents the mean of three experiments.

