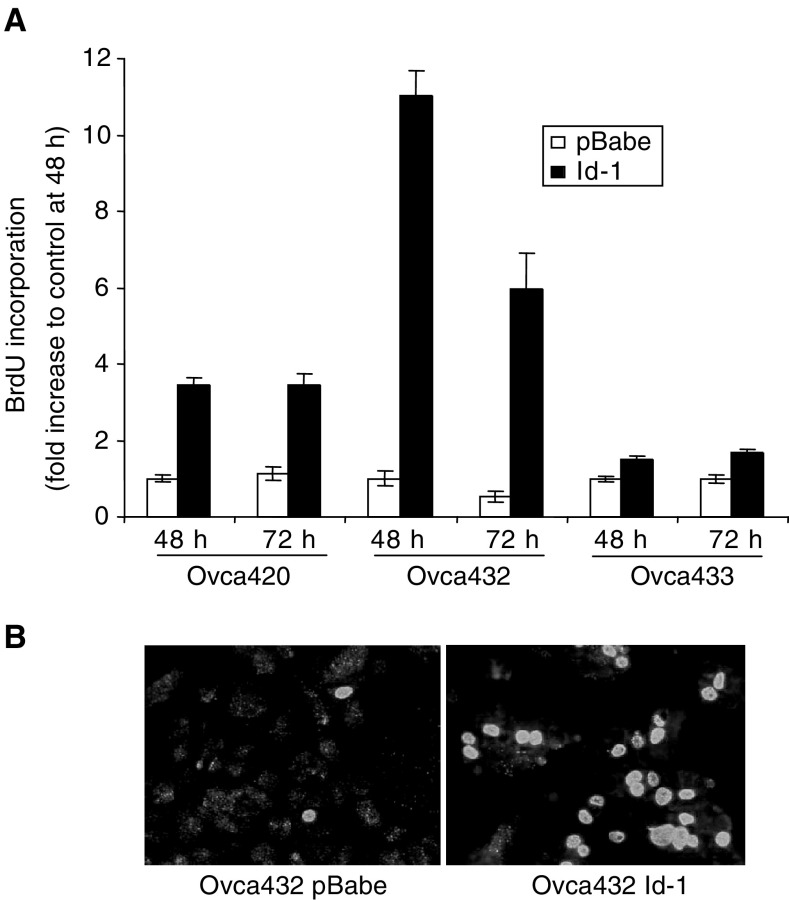
Figure 2.
Effect of ectopic Id-1 expression on ovarian cancer cell proliferation. (A) BrdU incorporation rate between the Id-1 transfectants and the vector controls. Cells were cultured in SFM for 48 and 72 h, respectively, and stained with an antibody against BrdU. At least 500 cells were counted in each experiment and the percentage of BrdU-positive cells was calculated and compared with the vector controls at 48 h time point, which was assigned as 1. Results presented as the mean and standard deviation from three experiments. (B) Representative results of BrdU staining. Strong nuclear FITC-positive signal was considered as BrdU positive. The background was enhanced to facilitate the counting of total cell numbers. Note that the percentage of BrdU-positive cells is higher in Id-1 transfectants than the pBabe control transfectants.

