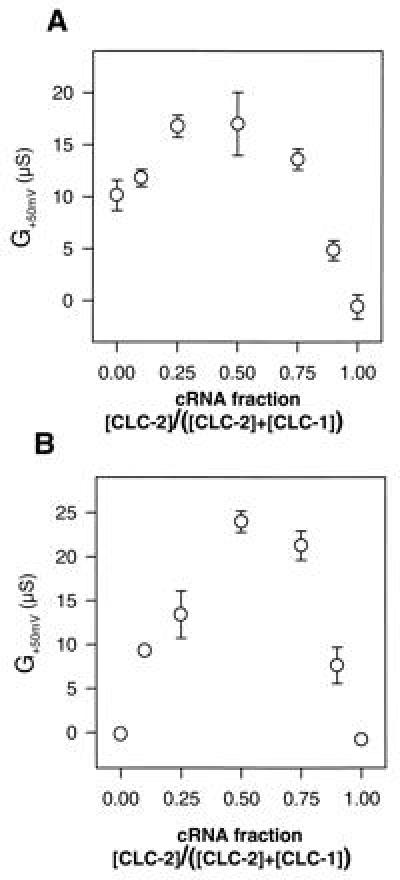
Figure 3.

Generation of CLC-1/CLC-2 heteromeric conductance as a function of cRNA concentration ratios. (A) Slope conductance at 50 mV measured in ND96 is plotted vs. the fraction of CLC-2 cRNA in the CLC-1/CLC-2 coinjection. Slope conductance of uninjected oocytes was subtracted. Conductance at +50 mV is predominantly due to heterooligomers. (B) Same as A (different oocytes from the same batch), but measured after incubation in 0.2 mM 9-AC that blocks CLC-1 homooligomers. Error bars = SEM, n = 4–5.
