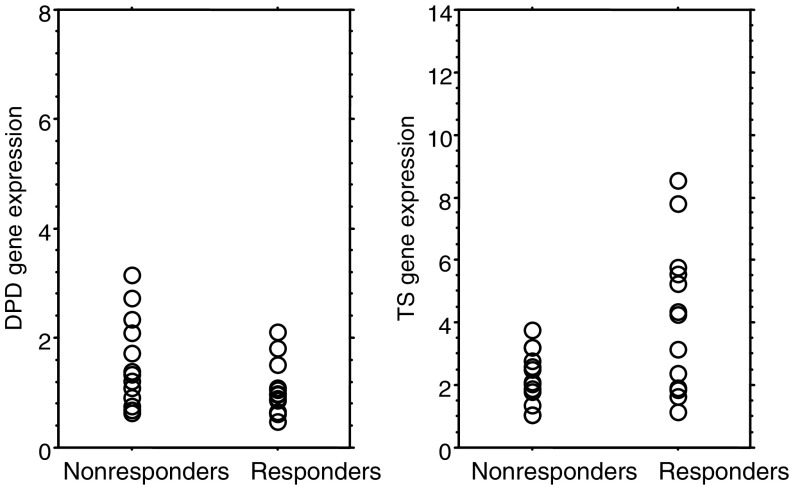
Figure 3.
DPD and TS mRNA in 26 primary gastric cancer treated with S-1+CPT-11 in relation to nonresponse or response. There was no statistical difference in DPD gene expression among responding and nonresponding tumours. Median values of TS mRNA expression in responding and nonresponding tumours were 4.26 and 2.11, respectively, with a trend in favour of a higher TS mRNA expression for responding tumours (P=0.055; Mann–Whitney U test).

