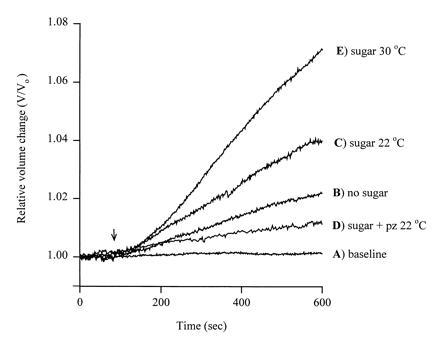
Figure 1.

Volume changes in oocytes expressing SGLT1. The relative change in volume V/Vo (Vo initial volume), was plotted as a function of time. The oocyte was injected with rabbit SGLT1 cRNA, and the plasma membrane capacitance (Cm), SGLT1 transient charge movements (Q), and steady-state sugar-induced currents were recorded simultaneously (11). The oocyte was equilibrated in a buffer containing 90 mM NaCl, 2 mM KCl, 1 mM CaCl2, 1 mM MgCl2, 10 mM Hepes·Tris (pH 7.4), and 20 mM mannitol at 22°C. After volume equilibration, the oocyte was continuously superfused (arrow) with a test solution at 22°C: In A the test solution was identical to the equilibration buffer and the volume change was less than 0.03% per minute. In B the 20 mM mannitol was absent producing an inward osmotic gradient of 20 milliosmoles/liter. In C the 20 mM mannitol was replaced with 5 mM α-methyl d-glucopyranoside (αMDG), a saturating concentration of transported sugar. In D the test solution was identical to that in C except that 100 μM phlorizin, a specific competitive inhibitor of SGLT1, was included. In E the test solution was identical to that in C, but the experiment was at 30°C. The membrane potential was clamped at −100 mV for C–E. The plasma membrane area was 0.33 cm2, as estimated from the capacitance (325 nF) (11). Qmax, the maximal charge transfer, was 90 nC, and given a valence of 3.5 (12) this is equivalent to 1.6 × 10¹¹ SGLT1 transporters in the plasma membrane. The sugar-induced currents were 1900 nA in C and 5000 nA in E. The increase in current (transport) was proportional to the increase in sugar-dependent water flow.
