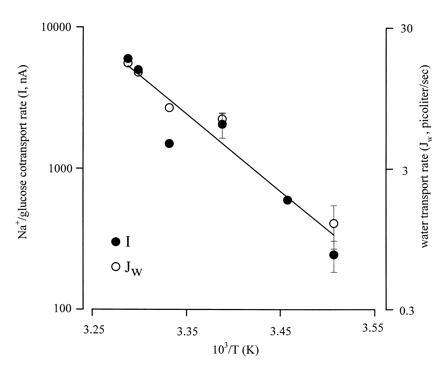
Figure 2.

Arrhenius plots of Na+/glucose cotransport and glucose-dependent water flow. Sugar transport (•) is given as the current produced by a saturating concentration of αMDG (5 mM) in oocytes expressing rabbit SGLT1 and clamped at −100 mV. Water transport (○) is estimated from the rate of volume change of the oocyte in the presence of αMDG in the same oocytes clamped at −100 mV. The line was drawn by linear regression with slope −13 ± 2 and corresponds to an activation energy Ea (Ea = −R·slope, R is the gas constant) of 26 ± 4 kcal/mol. The experiment was performed on five oocytes with Qmax = 65 ± 9 nC and Cm = 430 ± 34 nF. At 22°C, the sugar-dependent current was 2063 ± 420 nA. Data without error bars indicate individual experiments, and n was 5 oocytes at 22°C and 4 at 12°C.
