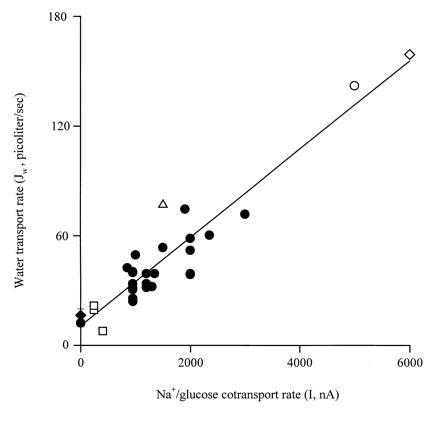
Figure 3.

Relationship between water transport and Na+/glucose cotransport. The data were obtained at different clamp voltages and temperatures: 31°C(⋄), 30°C (○), 27°C (▵), 22°C (•), and 12°C (□). At 0 nA, the data represented by • were obtained on control noninjected oocytes (n = 4) and ♦ were obtained in the presence of 5 mM αMDG and 100 μM phlorizin (n = 5). The slope 24 ± 2 × 10⁻³ pl per sec per nA corresponds to a turnover of 130 ± 9 mol of water per mol of inward positive charge. There was also a linear relationship between Jw and Qmax (slope, 4.9 ± 0.7 × 10⁻¹ pl per sec per nC) and between Imax and Qmax (slope, 23 ± 2/sec).
