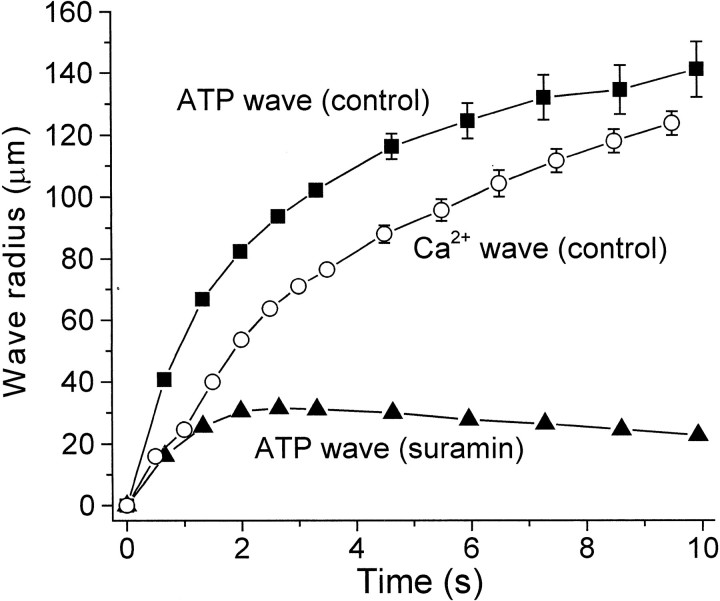
Fig. 8.
Comparison of ATP release wave and Ca2+ wave propagation. Wave radius is plotted as a function of time after stimulation for control ATP release waves (▪), ATP release waves in the presence of 100 μm suramin (▴), and control Ca2+ waves (○). Propagation of control ATP release waves precedes Ca2+ waves by ∼25 μm and ∼0.9 sec during the first seconds after stimulation. In the presence of suramin the ATP release fails to spread beyond 30 μm from the stimulation site. Threshold for detecting the leading edge of ATP waves was 3 μm ATP. Threshold for Ca2+ waves was a ΔF/F increase of 0.6. Means ± SEM are shown. n = 8, 6, and 8 for control ATP, suramin ATP, and Ca2+ waves, respectively. Shown are recordings from whole-mount retinas.

