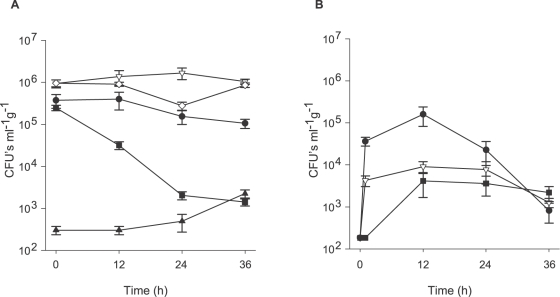
Figure 4. Adhesion experiment:
A. CFU's counts (ml−1) from SW samples. •-1×10⁶ cells ml−1 of culture P1 inoculated into SW without corals. ⋄-1×10⁶ cells ml−1 of culture from control isolate MF1 inoculated into SW without corals. ▪-1×10⁶ cells ml−1 of culture P1 inoculated into SW with Montipora aequituberculata coral fragments. ▿-1×10⁶ cells ml−1 of culture MF1 inoculated into SW with M. aequituberculata coral fragments. ▴-SW with M. aequituberculata coral fragments without inoculation. B. CFU's counts (ml−1 g−1) from crushed coral fragments. •-1×10⁶ cells ml−1 of culture P1 inoculated into SW with M. aequituberculata coral fragments. ▿- 1×10⁶ cells ml−1 of culture MF1 inoculated into SW with M. aequituberculata coral fragments. ▪-M. aequituberculata coral fragments without inoculation. Time represents hours (h) following exposure.CFU's ml−1 g−1 are presented in a logarithmic scale. Bars = Standard errors.

