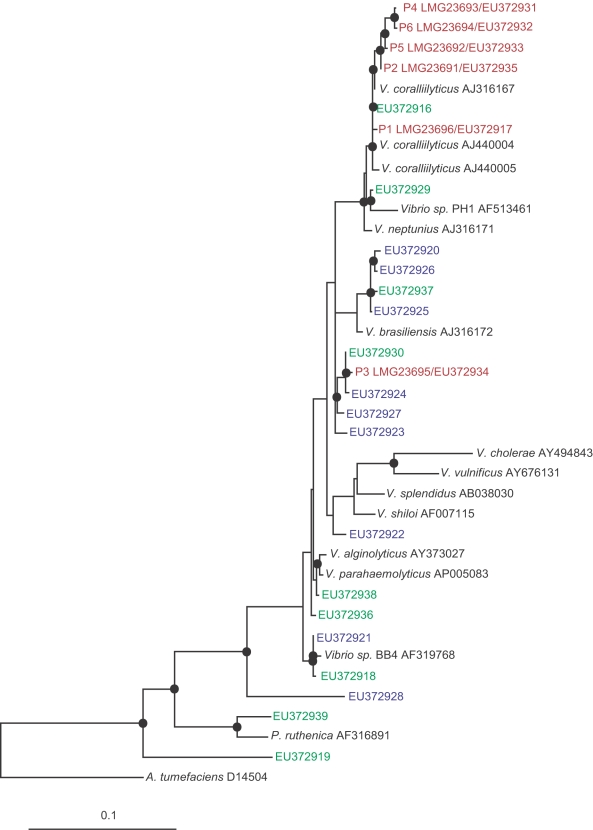
Figure 7. Phylogenetic tree of proteolitically-active isolates:
Evolutionary distance maximum likelihood analysis based on 16S rRNA gene sequences of isolates obtained by this study. Coral pathogens are marked in red. Reference strains are marked in black. Isolates that demonstrated high proteolytic activity (asocasein assay) and tested positive for a zinc-metalloprotease gene are presented in blue (Palau isolates) and in green (Nelly Bay GBR isolates). Nodes represent bootstrap values ≥50% based on 1000 re-samplings. Scale bar corresponds to 10% estimated sequence divergence.

