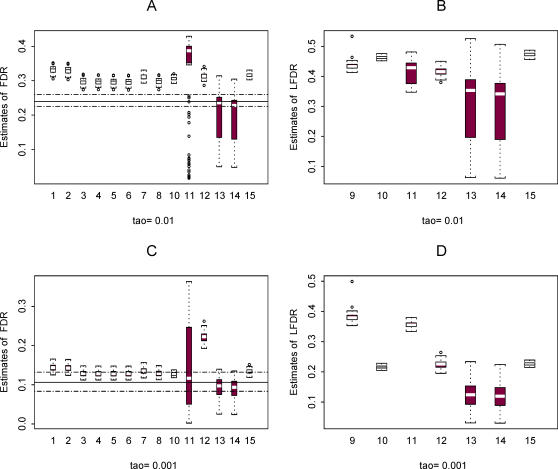
Figure 4. Plots of estimated FDR (A and C) and LFDR (B and D) using the 15 methods in 100 plasmodes from data set 2 for the case where π0 = 0.9.
Estimates calculated at two thresholds τ = 0.01 (A and B) and 0.001 (C and D) are shown. For the plots of FDR estimates, the horizontal line is the mean of the 100 true values of FDR in the plasmodes and the horizontal dashed lines are the minimum and maximum. True values of LFDR are not known.

