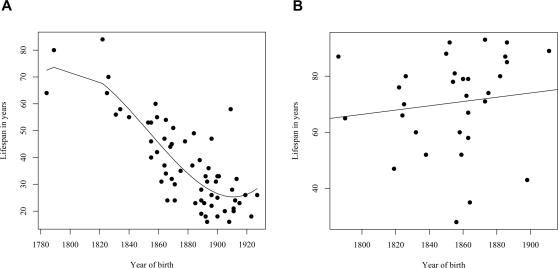
Figure 4. Families without DNA diagnosis.
(A)The relationship between the life span of L68Q mutation carriers (n = 64; assumed carrier group) in families without DNA diagnosis and their year of birth between the years 1780 and 1920. The line presents the fitted relationship from a polynomial regression (R2 = 0.68). (B) Relationship between the life span of 31 spouses of L68Q mutation carriers in families without DNA diagnosis and their year of birth. The line represents the fitted relationship from a linear regression (b = 0.076, P<0.494, R2 = 0.02).

