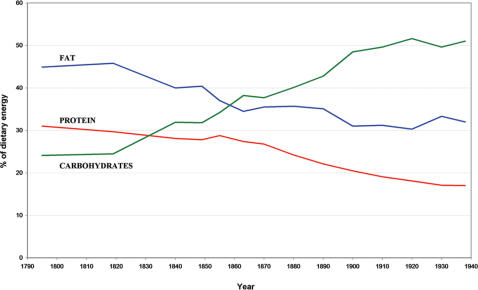
Figure 7. Changes in the percentage of dietary energy.
Derived from fat (blue line), protein (red line), and carbohydrates (green line) in Iceland from the year 1790–1940 (adapted from Jonsson [29]). Iceland was an isolated island with relatively little importation of food at the beginning of our study period, which then underwent drastic changes of dietary habits during the latter part of the 19th century. Records of imported food items per capita show a shift in the proportion of energy derived from carbohydrates from 25 % in 1840 to approximately 50 % in 1900; the proportion of energy derived from fat and protein decreased accordingly.

