
Table 4.
Table 4 Effect of Prompting Clinicians for Preventive Care Procedures in Studies with Three or More Interventions
| Preventive care measure | Number of interventions (number of studies) | Average difference % ± sd (min, max) | Distribution | |
|---|---|---|---|---|
| Vaccination | 64 (24) | 15 ± 14 [−15 to 50] |  |
|
| Fecal occult blood testing | 23 (16) | 12 ± 13 [−11 to 37] |  |
|
| Papanicolaou smear | 36 (20) | 12 ± 18 [−24 to 48] |  |
|
| Mammogram | 51 (23) | 10 ± 15 [−18 to 49] |  |
|
| Blood pressure | 22 (9) | 16 ± 19 [−8 to 59] | 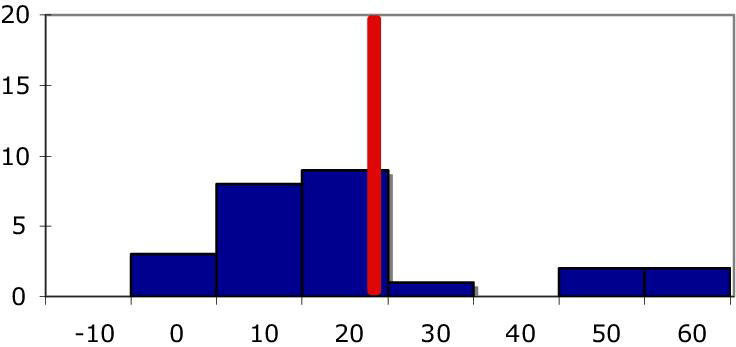 |
|
| Cholesterol | 8 (6) | 15 ± 17 [−1 to 54] |  |
|
| Diabetes management | 27 (8) | 15 ± 10 [5 to 51] |  |
|
| Smoking cessation | 6 (3) | 23 ± 16 [3 to 44] |  |
|
| Cardiac care | 25 (4) | 20 ± 11 [−8 to 59] |  |
|
sd – standard deviation; min – minimum; max – maximum