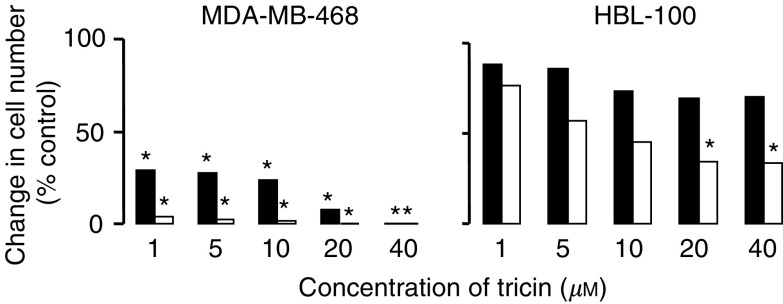
Figure 3.
Recovery of MDA-MB-468 and HBL-100 cells following treatment with tricin. Cells were treated with tricin for 168 h (open bars), or treated with tricin for 72 h and then kept for 96 h in medium omitting tricin (‘recovery’, closed bars). Cells cultured without tricin for the whole of the 168 h incubation period were included as controls. Values reflect the increase in cell number under the respective conditions at the end of the experiment over cell numbers observed at 72 h, and they are expressed as percentage of the fold increase in control cells from which tricin was omitted for the whole 168 h. Results are the mean±s.d. of n=3–5, the pooled s.d. was 12.7 and 12.5% of the mean for MDA-MB-468 and HBL-100 cells, respectively. Star indicates that cell numbers were significantly different from those in control cultures (P<0.05) as determined by the ANOVA general linear model followed by Fisher's least significant difference evaluation. For further details of cell culture and tricin treatment see Materials and Methods.

