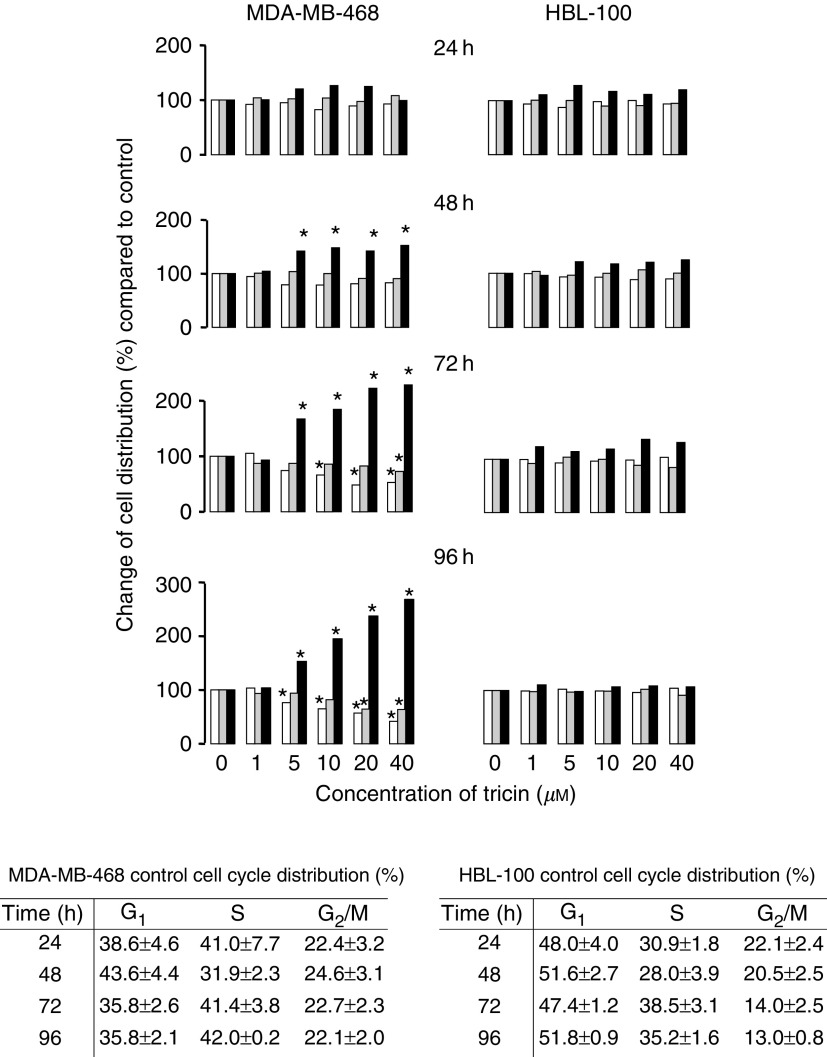
Figure 4.
Effect of tricin on distribution of MDA-MB-468 and HBL-100 cells in the G1 (open bars), S (grey bars) and G2/M (closed bars) phases of the cell cycle. Cells were analysed by flow cytometry following treatment with tricin or vehicle control for 24, 48, 72 or 96 h and staining with PI. Values (mean of n=4) reflect the change in percentage cell number under the respective conditions from the number in that phase in control cultures at each time point. The s.d. was between 0.64 and 8.7% of the mean. The tabular inserts show cell cycle distribution observed in control cultures expressed as percentage of total cells (100%), and the values are the mean±s.d. of n=4. Star indicates that cell cycle distribution was significantly different from that observed for control cultures (P<0.05, determined by the ANOVA general linear model followed by Fisher's least significant difference). For details of cell culture, tricin treatment and flow cytometry see Materials and Methods.

