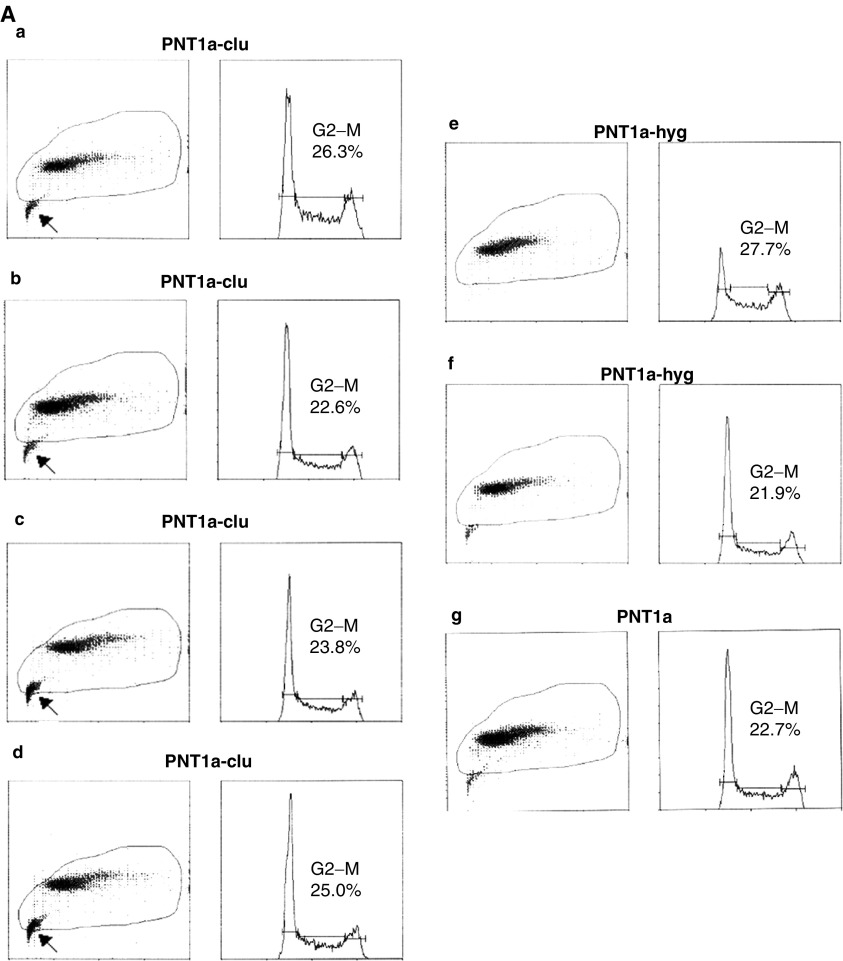
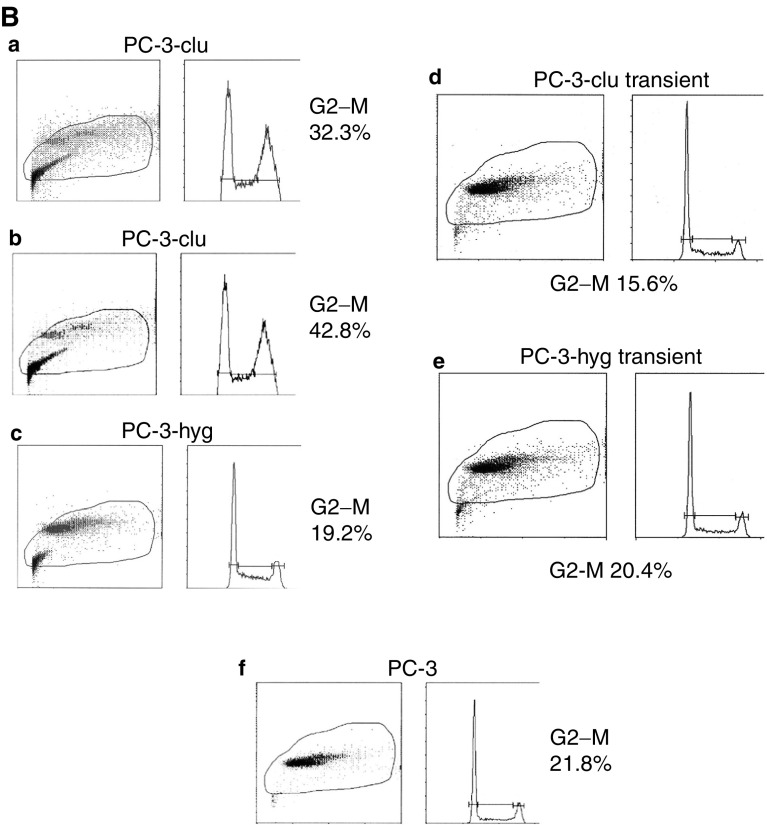
Figure 4.
FACS analysis of stable and transient transfectants. (A) Cell cycle analysis of stable PNT-clu (four independent clones, a–d) and PNT-hyg (two independent clones, e and f) in comparison with PNT1a parental cells (g). G2/M proportions are indicated for each cell type. Arrows indicate the presence of increased (apoptotic) cellular debris in all four PNT1a-clu populations relative to PNT1a-hyg and parental PNT1a cells. (B) Cell cycle analysis of stable PC-3-clu (two independent clones, a and b) and stable PC-3-hyg (c) in comparison with parental PC-3 cells (f) and PC-3 cells transiently transfected with pIRES-clu (d) and pIRES-hyg (e). G2/M proportions are indicated for each cell type.


