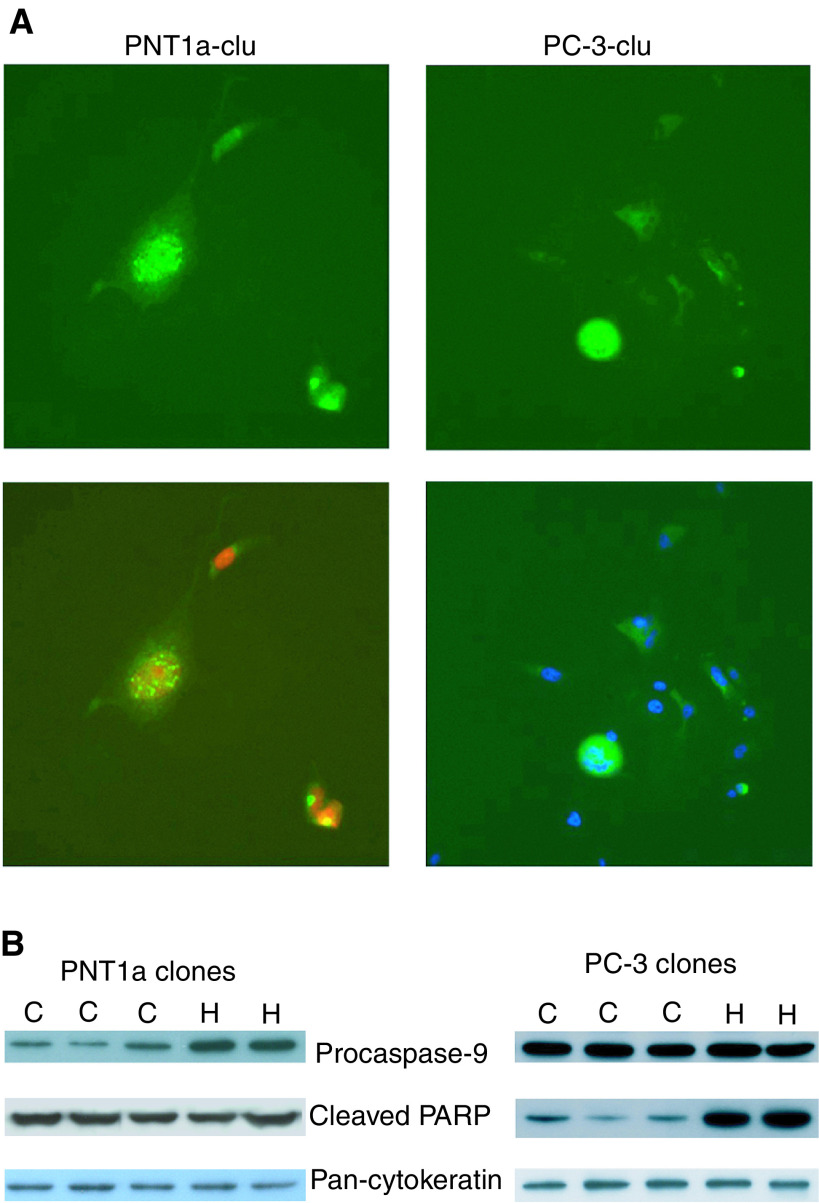
Figure 6.
Phenotype of PNT1A and PC-3 cells expressing clusterin.(A) Alexa-green fluorescence visualisation of clusterin localisation in PNT1a-clu cells (upper left) and PC-3-clu cells (upper right). The same images are shown, merged with DRAQ 5 red counterstaining (lower left) and with DAPI blue counterstaining (lower right). Magnification: × 400. (B) Procaspase-9 and cleaved PARP detected by Western blot in PNT1a-clu and PC-3-clu clones (C) as compared to PNT1a-hyg and PC-3-hyg clones (H). Equal protein loading was confirmed by pan-cytokeratin detection.

