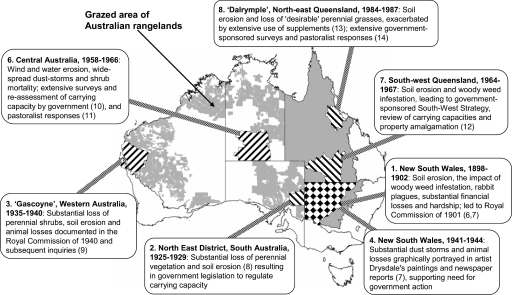
Fig. 2.
Map of Australian rangelands, locating and briefly describing the degradation episodes analyzed in this article (episode 5 is omitted; see Materials and Methods). Shading indicates pastoral areas (sheep or cattle), forward hatching indicates episode regions with longer droughts, and back hatching indicates shorter droughts (diamonds indicate New South Wales had one of each).

