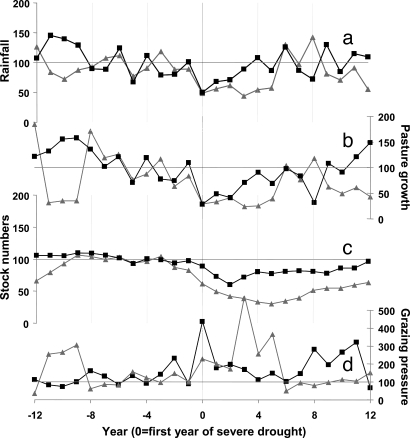
Fig. 3.
Time course of various features of the drought episodes plotted annually relative to start year of drought for each episode. (a) Rainfall (% of mean annual rainfall in base period). (b) Simulated pasture growth (percentage of mean pasture growth in base period). (c) Reported stock numbers (percentage of mean number in base period). (d) Grazing pressure (the ratio between the stock numbers and pasture growth, reported as percentage, a value of 100% implies the same balance between stocking and pasture growth as in each episode's baseline period; greater values indicate more stock than pasture growth). Each graph shows the mean of episodes 2, 4, 7, and 8 with short drought periods (■) and episodes 1, 3, and 6 with long drought periods (▲). (Adapted from figures 2.9 and 2.10 in ref. 1.)

